. 2015 Jan;25(1):14-26.
doi: 10.1101/gr.181016.114. Epub 2014 Sep 29.

U2AF1 mutations alter splice site recognition in hematological malignancies

Affiliations

U2AF1 mutations alter splice site recognition in hematological malignancies

Janine O Ilagan et al. Genome Res. 2015 Jan.

Abstract

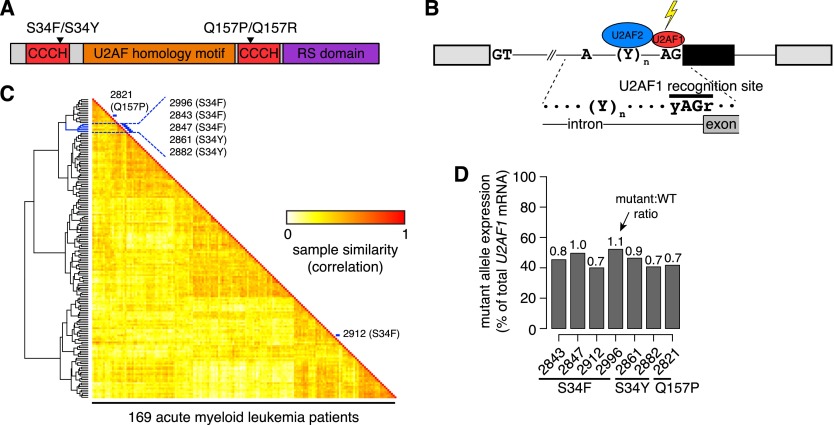
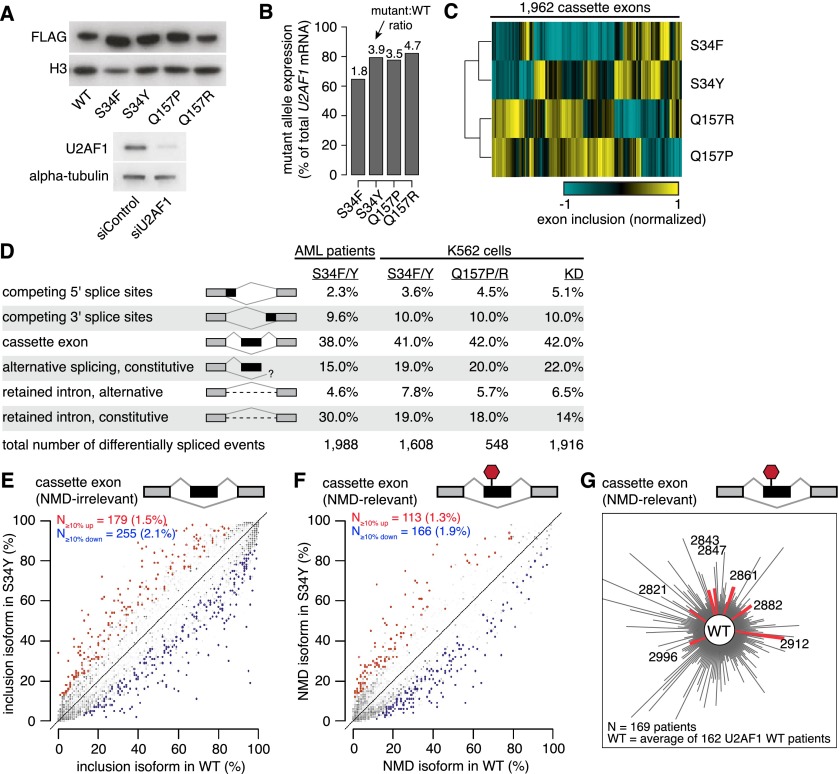
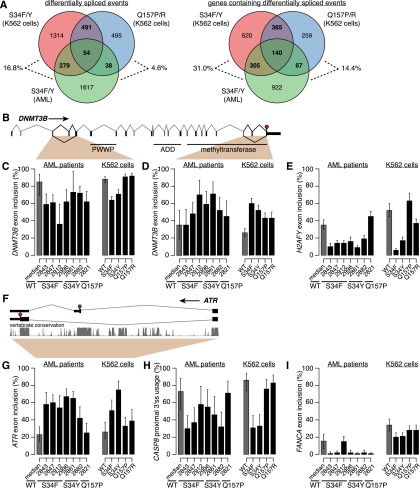
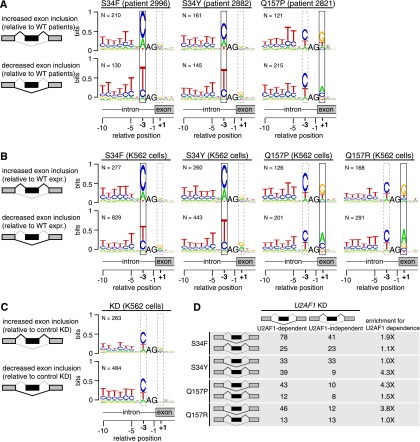
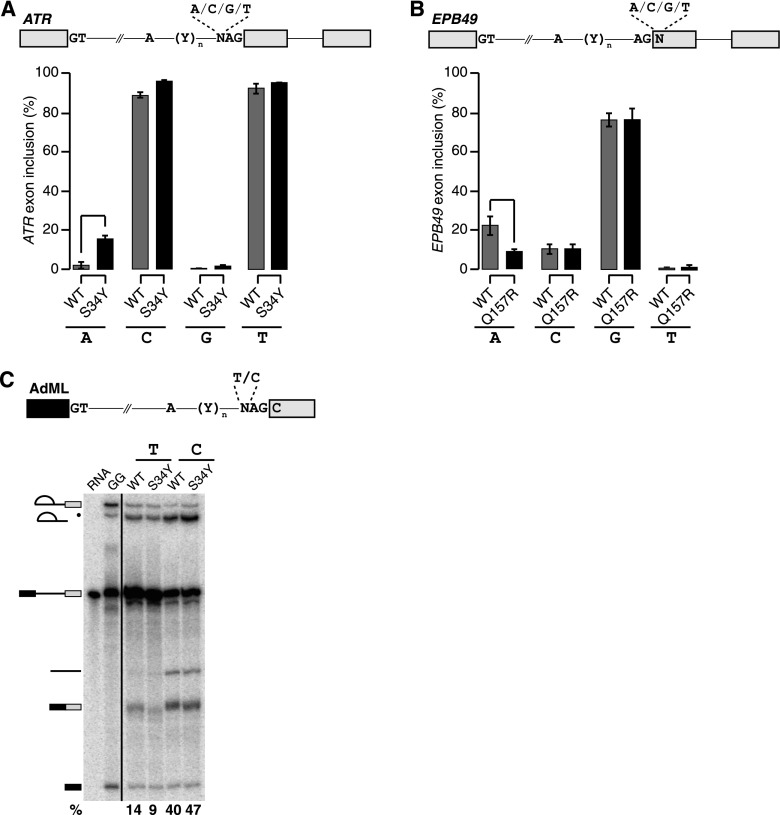
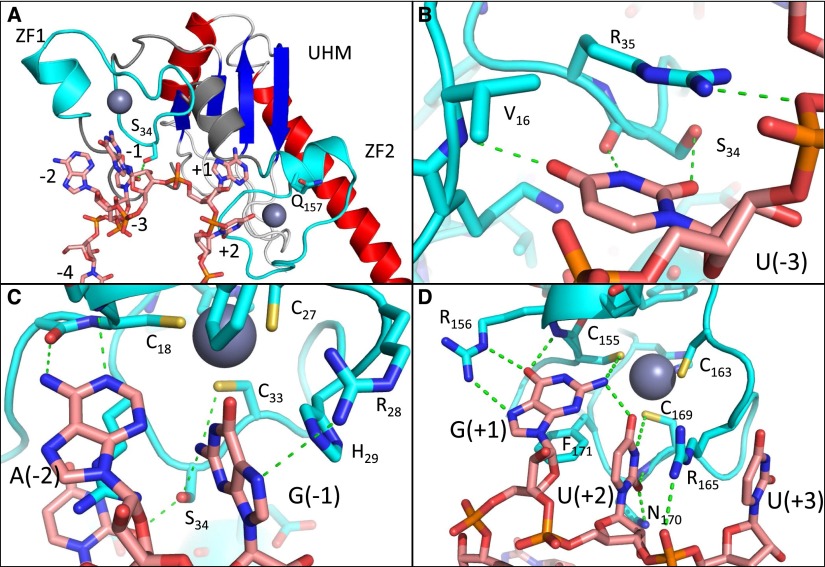
Whole-exome sequencing studies have identified common mutations affecting genes encoding components of the RNA splicing machinery in hematological malignancies. Here, we sought to determine how mutations affecting the 3' splice site recognition factor U2AF1 alter its normal role in RNA splicing. We find that U2AF1 mutations influence the similarity of splicing programs in leukemias, but do not give rise to widespread splicing failure. U2AF1 mutations cause differential splicing of hundreds of genes, affecting biological pathways such as DNA methylation (DNMT3B), X chromosome inactivation (H2AFY), the DNA damage response (ATR, FANCA), and apoptosis (CASP8). We show that U2AF1 mutations alter the preferred 3' splice site motif in patients, in cell culture, and in vitro. Mutations affecting the first and second zinc fingers give rise to different alterations in splice site preference and largely distinct downstream splicing programs. These allele-specific effects are consistent with a computationally predicted model of U2AF1 in complex with RNA. Our findings suggest that U2AF1 mutations contribute to pathogenesis by causing quantitative changes in splicing that affect diverse cellular pathways, and give insight into the normal function of U2AF1's zinc finger domains.


Figures

Figure 1.
Figure 1.
U2AF1 mutations contribute to splicing programs in AML. (A) U2AF1 domain structure (Kielkopf et al. 2001; The UniProt Consortium 2012) and common mutations. (CCCH) CCCH zinc finger. (B) Schematic of U2AF1 interaction with the 3′ splice site of a cassette exon (black). (C) Heat map illustrating similarity of alternative splicing programs in AML transcriptomes. Dendrogram is from an unsupervised cluster analysis based on cassette exon inclusion levels. (Blue) Samples with U2AF1 mutations. (D) U2AF1 mutant allele expression as a percentage of total U2AF1 mRNA in AML transcriptomes. Numbers above bars indicate the ratio of mutant to WT allele expression.
Figure 2.
Figure 2.
U2AF1 mutations alter splicing, but do not cause splicing failure. (A) Western blots showing levels of FLAG-tagged U2AF1 in K562 cells stably expressing the indicated alleles (top) and levels of endogenous U2AF1 in K562 cells following transfection with a nontargeting siRNA or a siRNA pool against U2AF1 (bottom). (B) U2AF1 mutant allele expression as a percentage of total U2AF1 mRNA in K562 cells. (C) Heat map of K562 cells expressing mutant U2AF1. Dendrogram is from an unsupervised cluster analysis based on cassette exon inclusion levels. (D) U2AF1 mutation-dependent changes in splicing for AML S34 versus WT patients, K562 S34F or S34Y versus WT expression, K562 Q157P or Q157R versus WT expression, and K562 U2AF1 KD versus control KD. Percentages indicate the fraction of mutation-dependent splicing changes falling into each category of splicing event. (E) Levels of cassette exon inclusion in K562 cells expressing WT or S34Y U2AF1. (N) Numbers of alternatively spliced cassette exons with increased/decreased inclusion; (percentages) fraction of alternatively spliced cassette exons that are affected by S34Y expression. Events that do not change significantly are rendered transparent. Plot restricted to cassette exon events that are predicted to not induce nonsense-mediated decay (NMD). (F) Levels of NMD-inducing isoforms of cassette exon events in K562 cells expressing WT or S34Y U2AF1. (G) Levels of NMD-inducing isoforms of cassette exon events in AML transcriptomes. Distance from the center measures the splicing dissimilarity between each AML transcriptome and the average of all U2AF1 WT samples, defined as the sum of absolute differences in expression of NMD-inducing isoforms.
Figure 3.
Figure 3.
U2AF1 mutations affect genes involved in disease-relevant cellular processes. (A) Overlap between mutation-dependent differential splicing in AML S34F/Y patients, K562 S34F/Y cells, and K562 Q157P/R cells. Overlap taken at the level of specific events (left) or genes containing differentially spliced events (right). (Percentages) The fraction of differentially spliced events (left) or genes containing differentially spliced events (right) in S34F/Y AML transcriptomes that are similarly differentially spliced in K562 cells expressing S34F/Y or Q157P/R U2AF1. (B) DNMT3B gene structure and protein domains (The UniProt Consortium 2012). Upstream 5′ UTR not shown. (PWWP) Pro-Trp-Trp-Pro domain; (ADD) ATRX-DNMT3-DNMT3L domain; (red stop sign) stop codon. (C,D) Inclusion of DNMT3B cassette exons. (Error bars) 95% confidence intervals as estimated from read coverage levels by MISO (Katz et al. 2010). (E) Inclusion of H2AFY cassette exon. (F) Cassette exon at 3′ end of ATR. Conservation is phastCons (Siepel et al. 2005) track from UCSC (Meyer et al. 2013). (G) Inclusion of cassette exon in ATR. (H) Usage of intron-proximal 3′ splice site of CASP8. (I) Inclusion of cassette exon in FANCA.
Figure 4.
Figure 4.
U2AF1 mutations alter 3′ splice site consensus sequences. (A) Consensus 3′ splice sites of cassette exons with increased or decreased inclusion in U2AF1 mutant relative to WT AML transcriptomes. Boxes highlight sequence preferences at the −3 and +1 positions that differ from the normal 3′ splice site consensus. (Vertical axis) Information content in bits; (N) number of cassette exons with increased or decreased inclusion in each sample. Data for all U2AF1 mutant samples is shown in Supplemental Figure S6. (B) As in A, but for K562 cells expressing the indicated mutation versus WT. (C) As in A, but for K562 cells following U2AF1 KD or control KD. (D) Overlap between cassette exons that are promoted or repressed by mutant versus WT expression (rows) and U2AF1 versus control KD (columns) in K562 cells. The third column indicates the enrichment for U2AF1 dependence, defined as the overlap between exons affected by mutant U2AF1 expression and exons repressed versus promoted by U2AF1 KD.
Figure 5.
Figure 5.
U2AF1 mutations cause sequence-dependent changes in 3′ splice site recognition. (A) Schematic of ATR minigene (top) and inclusion of ATR cassette exon transcribed from minigenes with A/C/G/T at the −3 position of the 3′ splice site in K562 cells expressing WT or S34Y U2AF1 (bottom). (Error bars) Standard deviation from biological triplicates. (B) Schematic of EPB49 minigene (top) and inclusion of EPB49 cassette exon transcribed from minigenes with A/C/G/T at the +1 position of the 3′ splice site in K562 cells expressing WT or Q157R U2AF1 (bottom). (C) Schematic of AdML pre-mRNA substrate used for in vitro splicing (top) and in vitro splicing of AdML substrate incubated with nuclear extract from K562 cells expressing WT or S34Y U2AF1 (bottom). Percentages are the fraction of second step products (spliced mRNA and lariat intron) relative to all RNA species after 60 min of incubation. (RNA) Input radiolabeled RNA; (GG) pre-mRNA with the AG dinucleotide replaced by GG to illustrate the first step product of splicing; (black dot) exonucleolytic “chew back” product of the lariat intermediate.
Figure 6.
Figure 6.
Theoretical model of the U2AF1:RNA complex. (A) Overview, with the zinc finger domains colored cyan, the RNA in salmon, the UHM beta sheet in blue, and alpha helices in red. The frequently mutated positions S34 and Q157 are shown in stick representation. (ZF) Zinc finger. (B–D) Interactions with individual bases characteristic of the 3′ splice site consensus. Green dotted lines indicate hydrogen bonds and favorable electrostatic interactions; RNA and selected side chains are shown in stick representation.

References

    1. Bradley RK, Merkin J, Lambert NJ, Burge CB. 2012. Alternative splicing of RNA triplets is often regulated and accelerates proteome evolution. PLoS Biol 10: e1001229. - PMC - PubMed
    1. Brooks AN, Choi PS, de Waal L, Sharifnia T, Imielinski M, Saksena G, Pedamallu CS, Sivachenko A, Rosenberg M, Chmielecki J, et al. . 2014. A pan-cancer analysis of transcriptome changes associated with somatic mutations in U2AF1 reveals commonly altered splicing events. PLoS ONE 9: e87361. - PMC - PubMed
    1. The Cancer Genome Atlas Research Network 2013. Genomic and epigenomic landscapes of adult de novo acute myeloid leukemia. N Engl J Med 368: 2059–2074. - PMC - PubMed
    1. Cvitkovic I, Jurica MS. 2012. Spliceosome Database: a tool for tracking components of the spliceosome. Nucleic Acids Res 41: D132–D141. - PMC - PubMed
    1. Flicek P, Ahmed I, Amode MR, Barrell D, Beal K, Brent S, Carvalho-Silva D, Clapham P, Coates G, Fairley S, et al. . 2013. Ensembl 2013. Nucleic Acids Res 41: D48–D55. - PMC - PubMed

Publication types

MeSH terms

Associated data