

Quantitative detection of human spermatogonia for optimization of spermatogonial stem cell culture
- PMID: 25267789
- PMCID: PMC4191455
- DOI: 10.1093/humrep/deu232
Quantitative detection of human spermatogonia for optimization of spermatogonial stem cell culture
Abstract
Study question: Can human spermatogonia be detected in long-term primary testicular cell cultures using validated, germ cell-specific markers of spermatogonia?
Summary answer: Germ cell-specific markers of spermatogonia/spermatogonial stem cells (SSCs) are detected in early (1-2 weeks) but not late (> 6 weeks) primary testicular cell cultures; somatic cell markers are detected in late primary testicular cell cultures.
What is known already: The development of conditions for human SSC culture is critically dependent on the ability to define cell types unequivocally and to quantify spermatogonia/SSCs. Growth by somatic cells presents a major challenge in the establishment of SSC cultures and therefore markers that define spermatogonia/SSCs, but are not also expressed by testicular somatic cells, are essential for accurate characterization of SSC cultures.
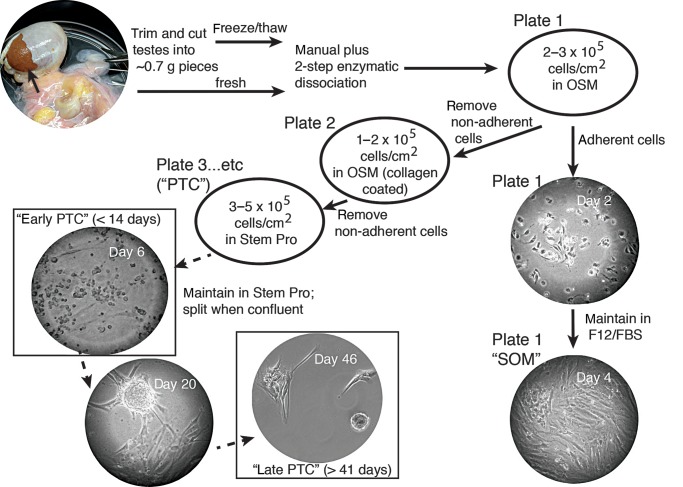
Study design, size, duration: Testicular tissue from eight organ donors with normal spermatogenesis was used for assay validation and establishing primary testicular cell cultures.
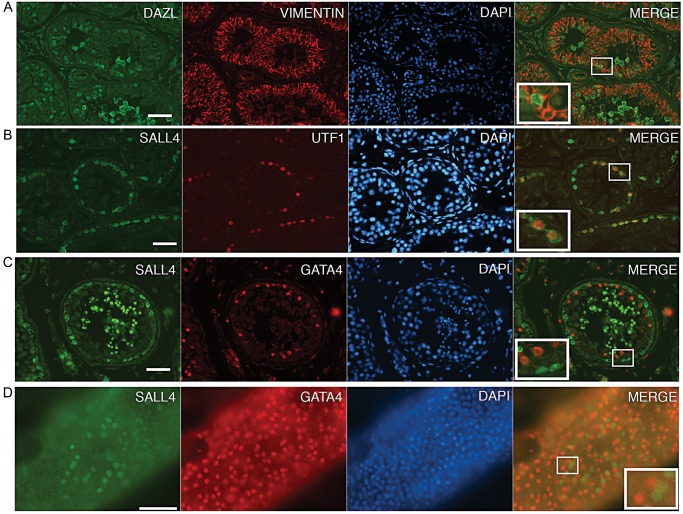
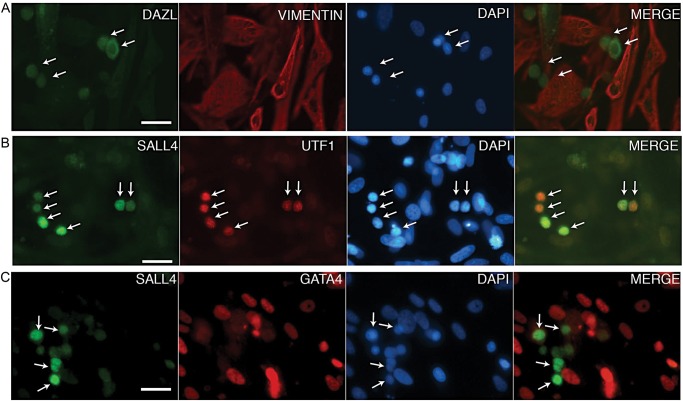
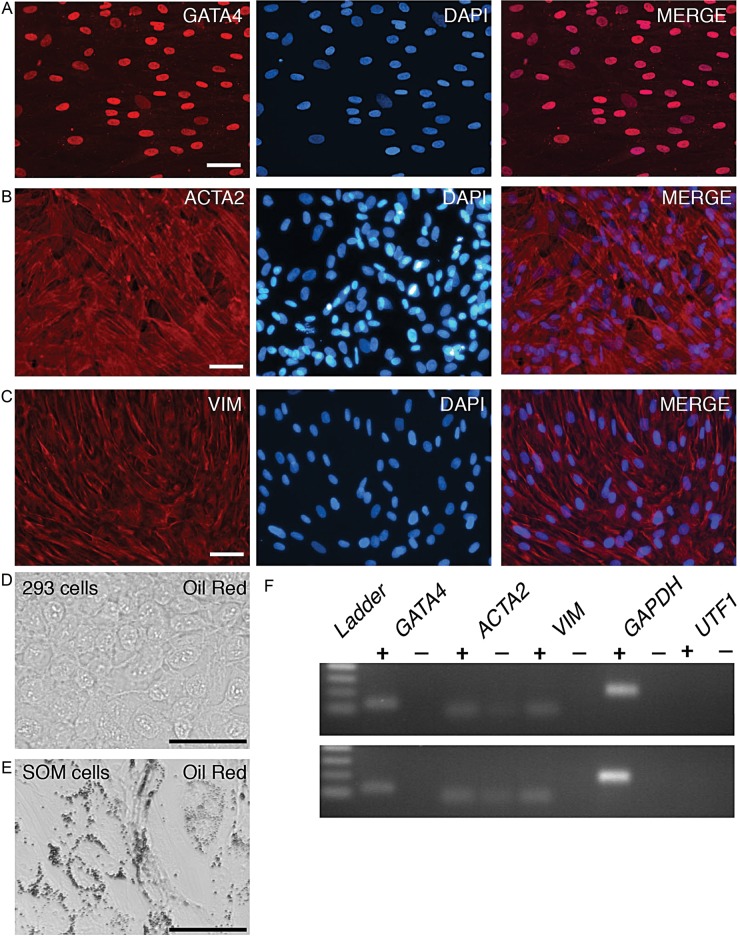
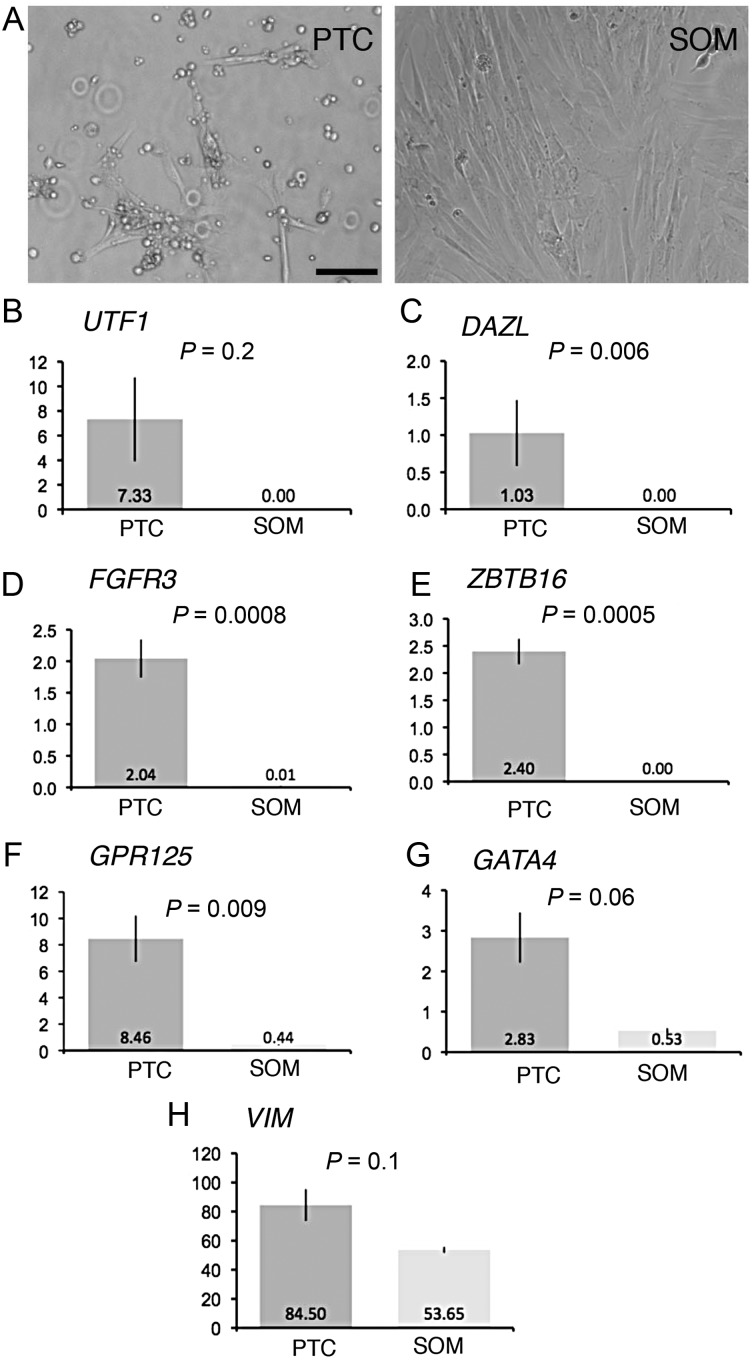
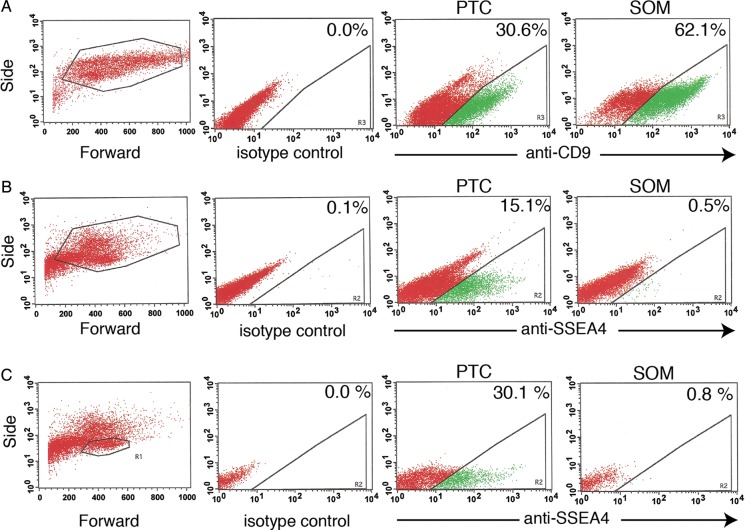
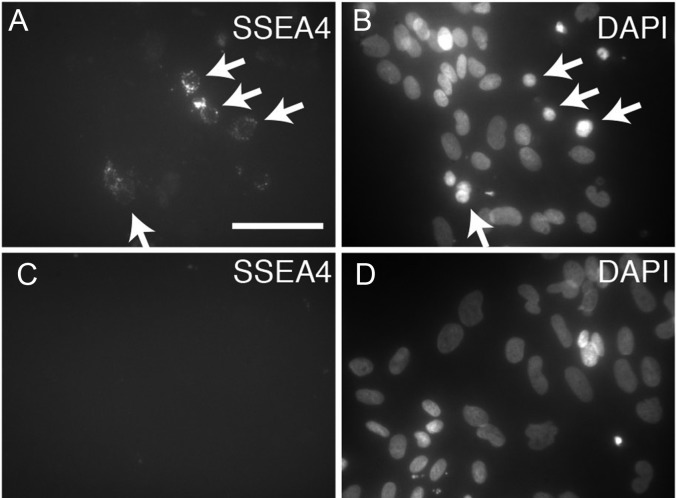
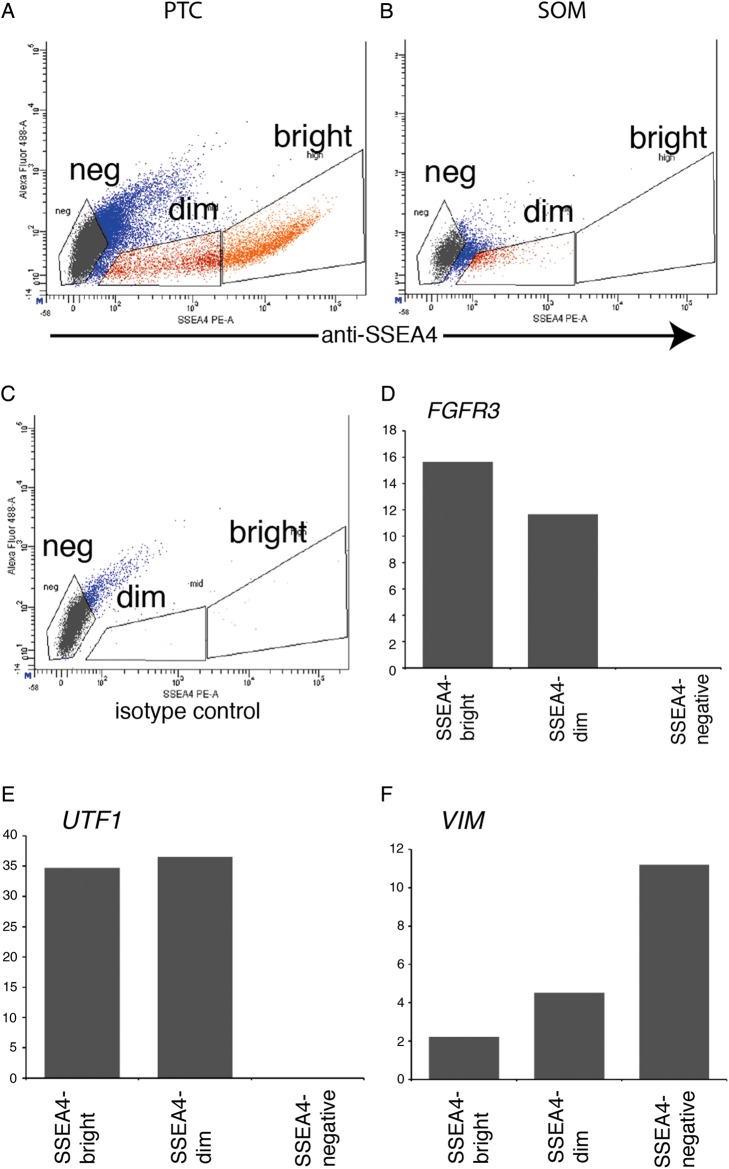
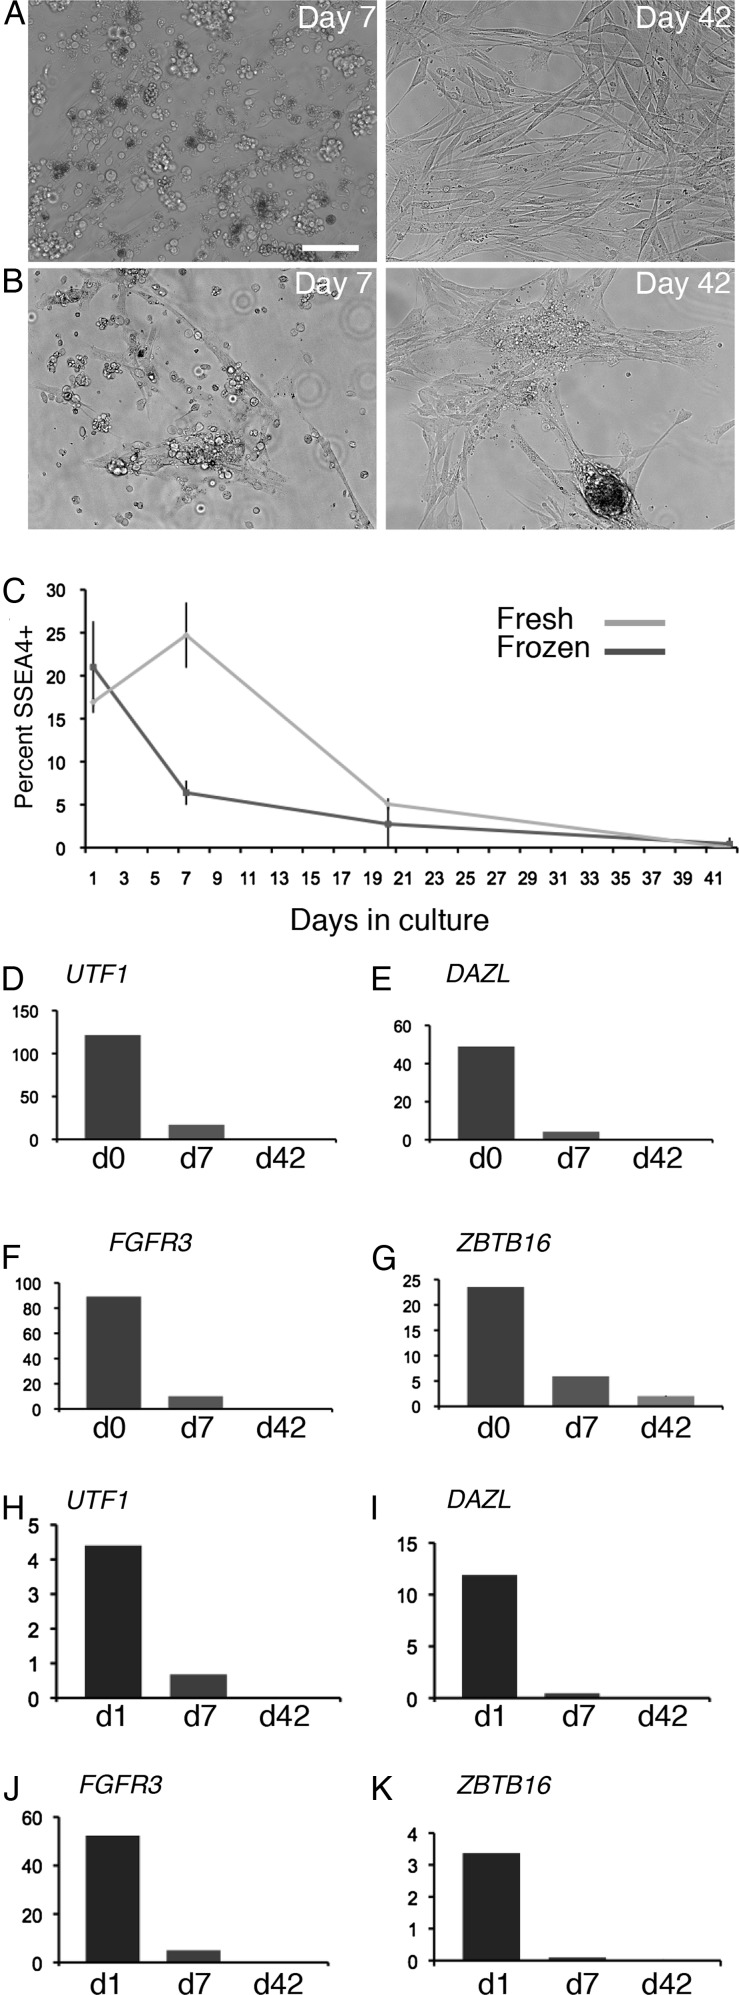
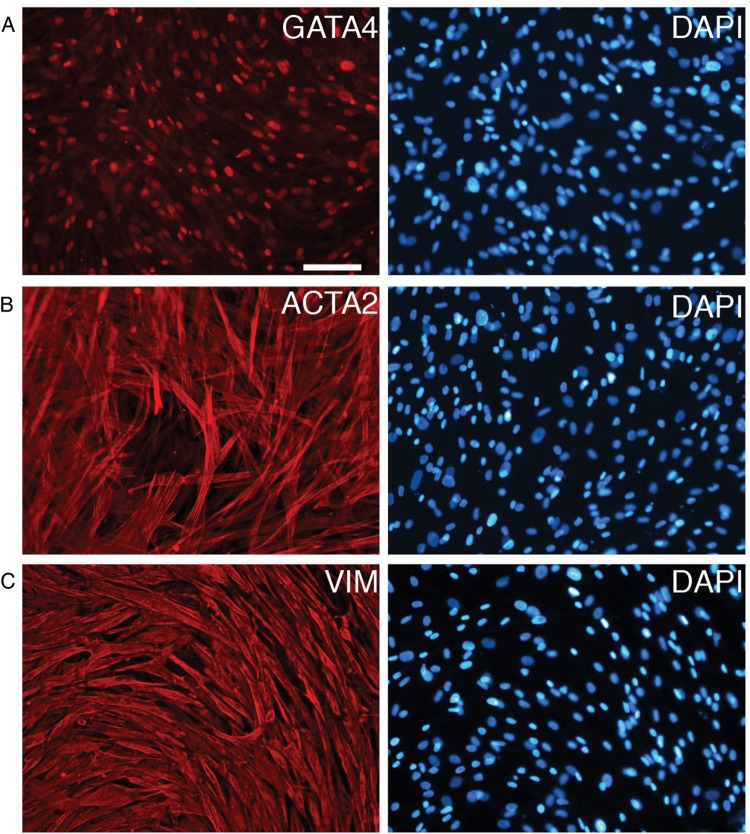
Participants/materials, setting, methods: Immunofluorescence analysis of normal human testicular tissue was used to validate antibodies (UTF1, SALL4, DAZL and VIM) and then the antibodies were used to demonstrate that primary testicular cells cultured in vitro for 1-2 weeks were composed of somatic cells and rare germ cells. Primary testicular cell cultures were further characterized by comparing to testicular somatic cell cultures using quantitative reverse transcriptase PCR (UTF1, FGFR3, ZBTB16, GPR125, DAZL, GATA4 and VIM) and flow cytometry (CD9 and SSEA4).
Main results and the role of chance: UTF1, FGFR3, DAZL and ZBTB16 qRT-PCR and SSEA4 flow cytometry were validated for the sensitive, quantitative and specific detection of germ cells. In contrast, GPR125 mRNA and CD9 were found to be not specific to germ cells because they were also expressed in testicular somatic cell cultures. While the germ cell-specific markers were detected in early primary testicular cell cultures (1-2 weeks), their expression steadily declined over time in vitro. After 6 weeks in culture only somatic cells were detected.
Limitations, reasons for caution: Different groups attempting SSC culture have utilized different sources of human testes and minor differences in the preparation and maintenance of the testicular cell cultures. Differences in outcome may be explained by genetic background of the source tissue or technical differences.
Wider implications of the findings: The ability to propagate human SSCs in vitro is a prerequisite for proposed autologous transplantation therapy aimed at restoring fertility to men who have been treated for childhood cancer. By applying the assays validated here it will be possible to quantitatively compare human SSC culture conditions. The eventual development of conditions for long-term propagation of human SSCs in vitro will greatly facilitate learning about the basic biology of these cells and in turn the ability to use human SSCs in therapy.
Study funding/competing interests: The experiments presented in this manuscript were funded by a Project Development Team within the ICTSI NIH/NCRR Grant Number TR000006. The authors declare no competing interests.
Trial registration number: Not applicable.
Keywords: cell culture; fertility; germ cells; stage-specific embryonic antigens; testis.
© The Author 2014. Published by Oxford University Press on behalf of the European Society of Human Reproduction and Embryology. All rights reserved. For Permissions, please email: journals.permissions@oup.com.
Figures
Similar articles
-
A combined approach facilitates the reliable detection of human spermatogonia in vitro.Hum Reprod. 2013 Nov;28(11):3012-25. doi: 10.1093/humrep/det336. Epub 2013 Sep 3. Hum Reprod. 2013. PMID: 24001715
-
Isolation and gene expression analysis of single potential human spermatogonial stem cells.Mol Hum Reprod. 2016 Apr;22(4):229-39. doi: 10.1093/molehr/gaw006. Epub 2016 Jan 20. Mol Hum Reprod. 2016. PMID: 26792870
-
Separation of somatic and germ cells is required to establish primate spermatogonial cultures.Hum Reprod. 2014 Sep;29(9):2018-31. doi: 10.1093/humrep/deu157. Epub 2014 Jun 24. Hum Reprod. 2014. PMID: 24963164
-
Human spermatogonial stem cells: a possible origin for spermatocytic seminoma.Int J Androl. 2011 Aug;34(4 Pt 2):e296-305; discussion e305. doi: 10.1111/j.1365-2605.2011.01199.x. Int J Androl. 2011. PMID: 21790653 Free PMC article. Review.
-
Spermatogonial stem cell preservation and transplantation: from research to clinic.Hum Reprod. 2013 Apr;28(4):897-907. doi: 10.1093/humrep/det039. Epub 2013 Feb 20. Hum Reprod. 2013. PMID: 23427228 Review.
Cited by
-
ITGA6+ Human Testicular Cell Populations Acquire a Mesenchymal Rather than Germ Cell Transcriptional Signature during Long-Term Culture.Int J Mol Sci. 2020 Nov 4;21(21):8269. doi: 10.3390/ijms21218269. Int J Mol Sci. 2020. PMID: 33158248 Free PMC article.
-
Previously claimed male germline stem cells from porcine testis are actually progenitor Leydig cells.Stem Cell Res Ther. 2018 Jul 18;9(1):200. doi: 10.1186/s13287-018-0931-0. Stem Cell Res Ther. 2018. PMID: 30021628 Free PMC article.
-
Fertility preservation in Hodgkin's lymphoma patients that undergo targeted molecular therapies: an important step forward from the chemotherapy era.Cancer Manag Res. 2018 Jun 13;10:1517-1526. doi: 10.2147/CMAR.S154819. eCollection 2018. Cancer Manag Res. 2018. PMID: 29942153 Free PMC article. Review.
-
Favorable culture conditions for spermatogonial propagation in human and non-human primate primary testicular cell cultures: a systematic review and meta-analysis.Front Cell Dev Biol. 2024 Jan 8;11:1330830. doi: 10.3389/fcell.2023.1330830. eCollection 2023. Front Cell Dev Biol. 2024. PMID: 38259514 Free PMC article.
-
Preservation of fertility in female and male prepubertal patients diagnosed with cancer.J Assist Reprod Genet. 2023 Dec;40(12):2755-2767. doi: 10.1007/s10815-023-02945-2. Epub 2023 Sep 29. J Assist Reprod Genet. 2023. PMID: 37770817 Free PMC article. Review.
References
-
- Caires K, Broady J, McLean D. Maintaining the male germline: regulation of spermatogonial stem cells. J Endocrinol. 2010;205:133–145. - PubMed
-
- de Rooij DG, Mizrak SC. Deriving multipotent stem cells from mouse spermatogonial stem cells: a new tool for developmental and clinical research. Development. 2008;135:2207–2213. - PubMed
Publication types
MeSH terms
Substances
Grants and funding
LinkOut - more resources
Full Text Sources
Other Literature Sources
Molecular Biology Databases
Research Materials
Miscellaneous
