

Occupational class inequalities in all-cause and cause-specific mortality among middle-aged men in 14 European populations during the early 2000s
- PMID: 25268702
- PMCID: PMC4182439
- DOI: 10.1371/journal.pone.0108072
Occupational class inequalities in all-cause and cause-specific mortality among middle-aged men in 14 European populations during the early 2000s
Abstract
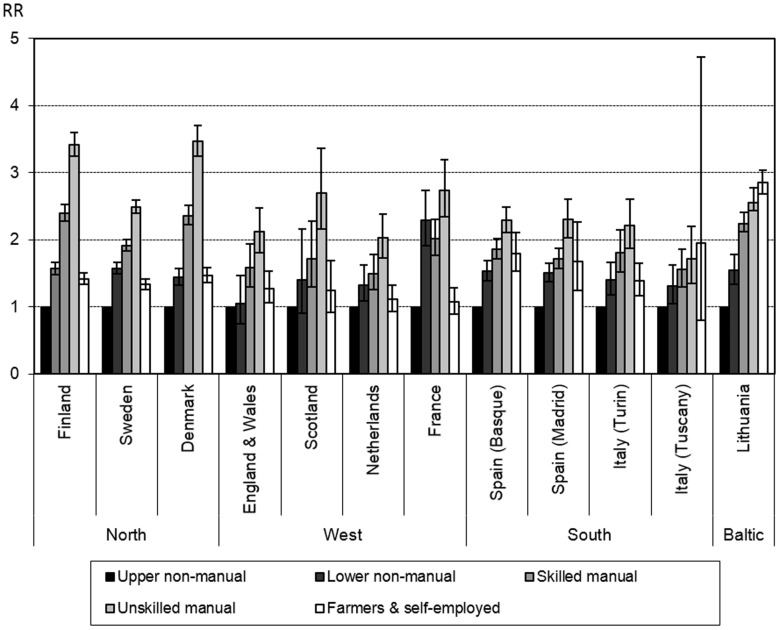
This study analyses occupational class inequalities in all-cause mortality and four specific causes of death among men, in Europe in the early 2000s, and is the most extensive comparative analysis of occupational class inequalities in mortality in Europe so far. Longitudinal data, obtained from population censuses and mortality registries in 14 European populations, from around the period 2000-2005, were used. Analyses concerned men aged 30-59 years and included all-cause mortality and mortality from all cancers, all cardiovascular diseases (CVD), all external, and all other causes. Occupational class was analysed according to five categories: upper and lower non-manual workers, skilled and unskilled manual workers, and farmers and self-employed combined. Inequalities were quantified with mortality rate ratios, rate differences, and population attributable fractions (PAF). Relative and absolute inequalities in all-cause mortality were more pronounced in Finland, Denmark, France, and Lithuania than in other populations, and the same countries (except France) also had the highest PAF values for all-cause mortality. The main contributing causes to these larger inequalities differed strongly between countries (e.g., cancer in France, all other causes in Denmark). Relative and absolute inequalities in CVD mortality were markedly lower in Southern European populations. We conclude that relative and absolute occupational class differences in all-cause and cause specific mortality have persisted into the early 2000's, although the magnitude differs strongly between populations. Comparisons with previous studies suggest that the relative gap in mortality between occupational classes has further widened in some Northern and Western European populations.
Conflict of interest statement
Figures
References
-
- Leon DA (2011) Trends in European life expectancy: a salutary view. International Journal of Epidemiology 7. - PubMed
-
- Donkin A, Goldblatt P, Lynch K (2002) Inequalities in life expectancy by social class, 1972–1999. Health Statistics Quarterly 15: 5–15.
-
- Mackenbach JP, Bos V, Andersen O, Cardano M, Costa G, et al. (2003) Widening socioeconomic inequalities in mortality in six Western European countries. International Journal of Epidemiology 32: 830–837. - PubMed
Publication types
MeSH terms
LinkOut - more resources
Full Text Sources
Other Literature Sources
Miscellaneous
