. 2014 Nov 21;139(22):5989-98.
doi: 10.1039/c4an01177e.

Online SERS detection of the 20 proteinogenic L-amino acids separated by capillary zone electrophoresis

Affiliations

Online SERS detection of the 20 proteinogenic L-amino acids separated by capillary zone electrophoresis

Pierre Negri et al. Analyst. .

Abstract

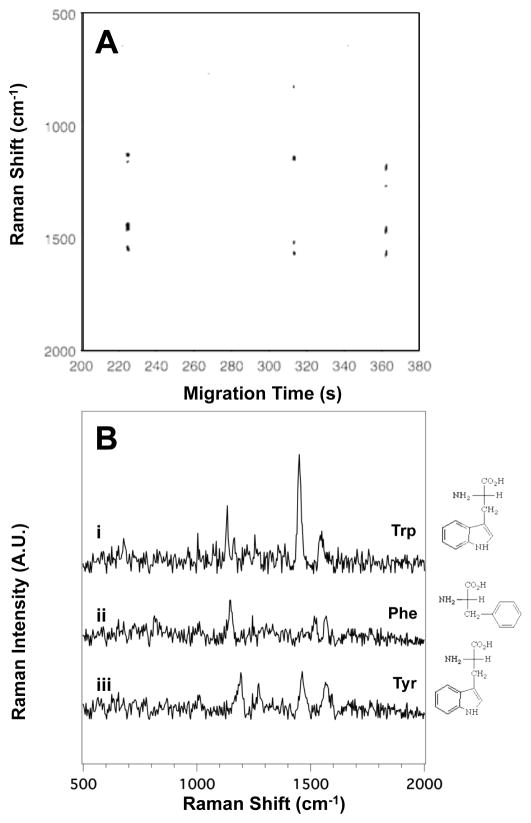
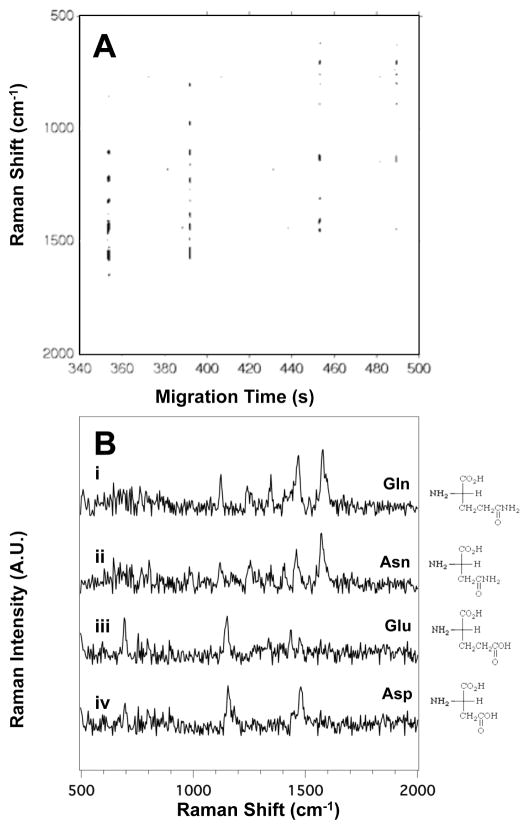
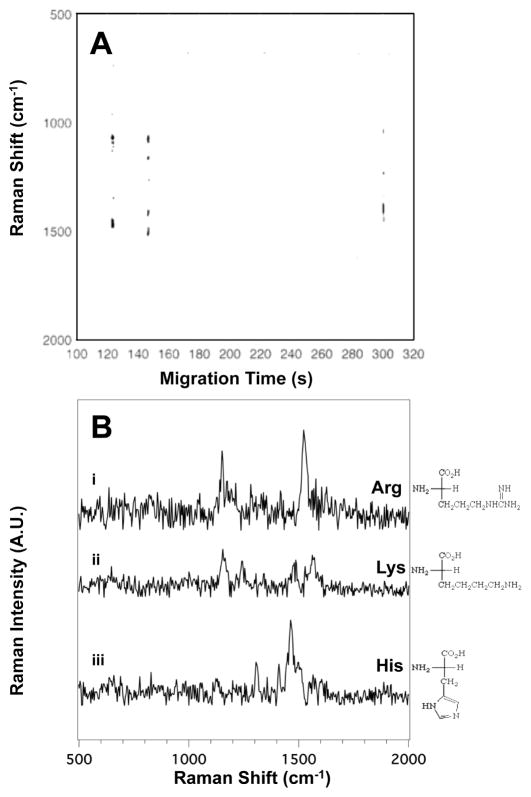
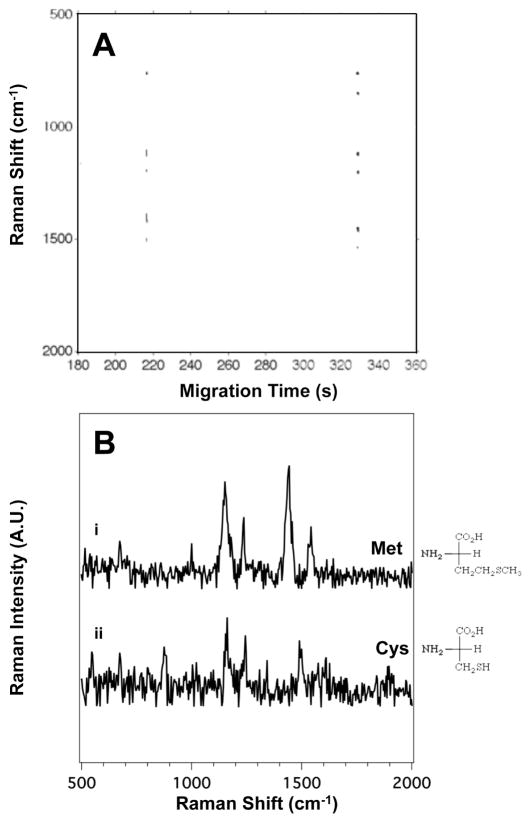
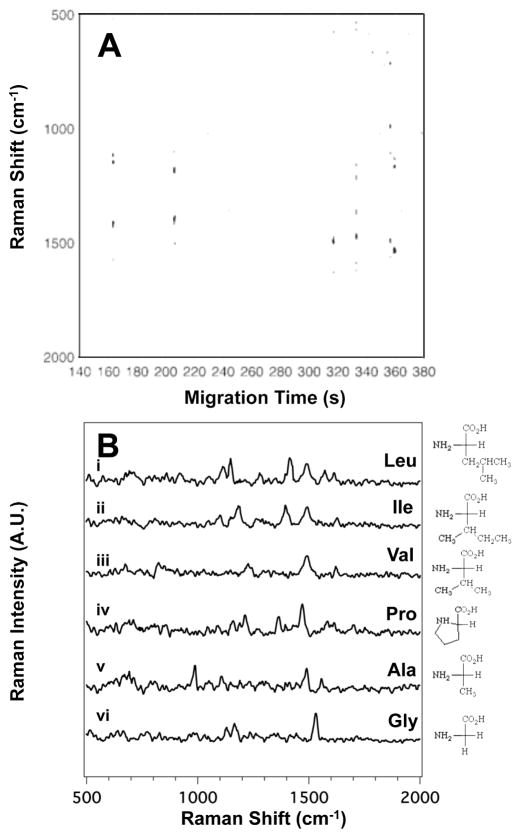
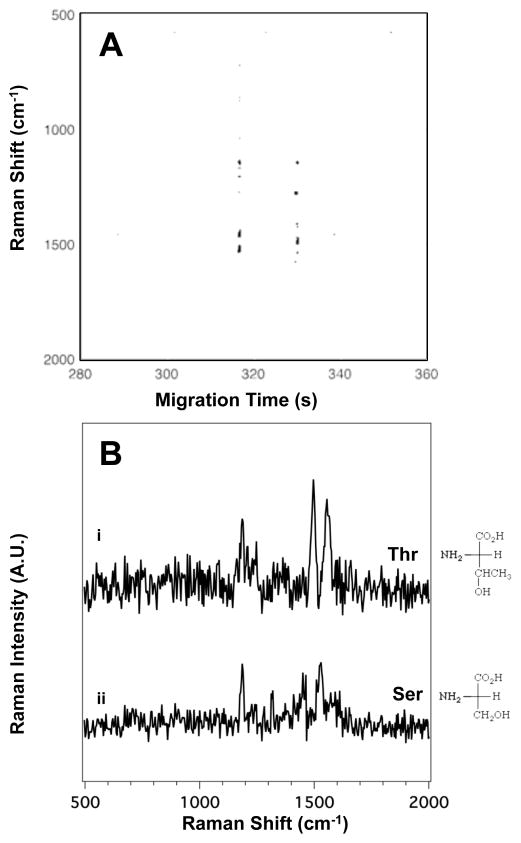
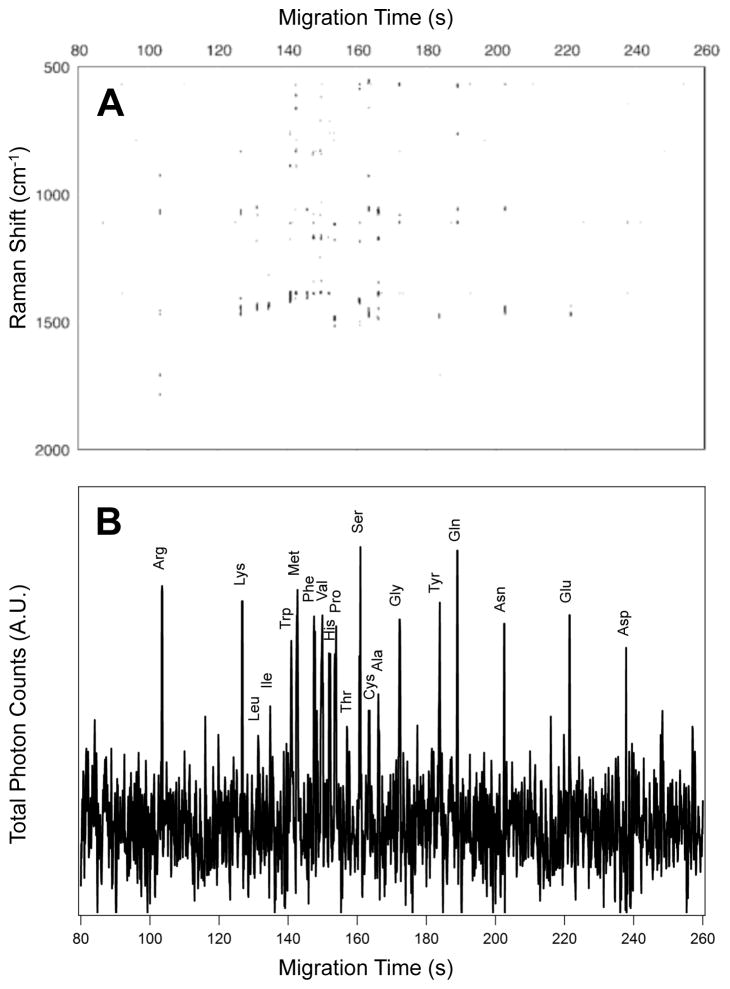
A sheath-flow surface-enhanced Raman scattering (SERS) detector is demonstrated to provide chemical information enabling identification of the 20 proteinogenic L-amino acids separated by capillary zone electrophoresis (CZE). Amino acids were used to illustrate the chemical specificity of SERS detection from structurally related molecules. Analysis of the SERS electropherograms obtained from the separation and sequential online detection of six groups of structurally related amino acids shows that our sheath-flow SERS detector is able to resolve the characteristic Raman bands attributed to the amine, carboxyl, and side chain constituents. The results demonstrate the chemical information available from our detector and also provide insight into the nature of the analyte interaction with the silver SERS substrate. The spectra extracted from the SERS electropherogram of a mixture containing the 20 proteinogenic L-amino acids show unique signatures characteristic to each amino acid, thus enabling identification. The results presented here demonstrate the potential of this sheath-flow SERS detector as a general purpose method for high throughput characterization and identification following separations of complex biomolecular mixtures.


Figures

Figure 1
Figure 1
(A) The SERS electropherogram of the three aromatic side chain amino acids indicates that Trp migrates at tm = 224 ± 6 s, Phe at tm = 310 ± 11 s, and Tyr at tm = 361 ± 8 s. The signal threshold (>4σ) was set to 250 counts. (B) Averaged SERS spectra of (i) Trp, (ii) Phe, and (iii) Tyr were extracted from the electropherogram in (A) between 223.5 and 224.5 s, 312.3 and 313.1 s, and 361.1 and 362.1 s, respectively. The amino acid concentration in this mixture is 3.3×10⁻⁴ M.
Figure 2
Figure 2
(A) The SERS electropherogram of the four acidic and amide side chain amino acids indicates that Gln migrates at tm = 350 ± 12s, Asn at tm = 391 ± 8 s, Glu at tm = 460 ± 10 s, and Asp at tm = 490 ± 14 s. The signal threshold (>4σ) was set to 530 counts. (B) Averaged SERS spectra of (i) Gln, (ii) Asn, (iii) Glu, and (iv) Asp were extracted from the electropherogram in (A) between 352.6 and 353.2 s, 391.2 and 391.8 s, 456.2 and 457.0 s, and 487.9 and 488.8 s, respectively. The amino acid concentration in this mixture is 2.5×10⁻⁴ M.
Figure 3
Figure 3
(A) The SERS electropherogram of the three basic side chain amino acids acids indicates that Arg migrates at tm = 123 ± 4 s, Lys migrates at tm = 146 ± 7 s, and His at tm = 299 ± 9 s. The signal threshold (>4σ) was set to 430 counts. (B) Averaged SERS spectra of (i) Arg, (ii) Lys, and (iii) His were extracted from the electropherogram in (A) between 122.6 and 123.5 s, 146.2 and 147.0 s, and 298.7 and 299.5 s, respectively. The amino acid concentration in this mixture is 3.3×10⁻⁴ M.
Figure 4
Figure 4
(A) The SERS electropherogram of the two sulfur-containing side chain amino acids indicates that Met migrates at tm = 216 ± 8 s and Cys at tm = 329 ± 6 s. The signal threshold (>4σ) was set to 680 counts. (B) Averaged SERS spectra of (i) Met and (ii) Cys were extracted from the electropherogram in (A) between 215.6 and 216.1 s, and 328.7 and 329.4 s, respectively. The amino acid concentration in this mixture is 5.0×10⁻⁴ M.
Figure 5
Figure 5
(A) The SERS electropherogram of the six aliphatic side chain amino acids indicates that Leu migrates at tm = 163 ± 8 s, Ile at tm = 206 ± 5 s, Val at tm = 320 ± 11 s, Pro at tm = 332 ± 7 s, Ala at tm = 360 ± 10 s, and Gly at tm = 360 ± 14 s. The signal threshold (>4σ) was set to 230. (B) Averaged SERS spectra of (i) Leu, (ii) Ile, (iii) Val, (iv) Pro, (v) Ala, and (iv) Gly extracted from the electropherogram in (A) between 162.9 and 163.6 s, 205.7 and 206.6 s, 316.5 and 317.2 s, 332.5 and 333.1 s, 356.2 and 357.0 s, and 358.7 and 359.5 s, respectively. The amino acid concentration in this mixture is 16×10−5 M.
Figure 6
Figure 6
(A) The SERS electropherogram of the two alcoholic amino acids indicates that Thr migrates at tm = 320 ± 13 s and Ser at tm = 330 ± 15 s. The signal threshold (>4σ) was set to 960 counts. (B) Averaged SERS spectra of (i) Thr and (ii) Ser were extracted from the electropherogram in (A) between 316.2 and 317.0 s, and 329.4 and 329.1 s, respectively. The amino acid concentration in this mixture is 5.0×10⁻⁴ M.
Figure 7
Figure 7
(A) The SERS electropherogram following the electrophoretic separation of the twenty proteinogenic L-amino acids indicates that Arg migrates at tm = 108.8 s, Lys migrates at tm = 110.2 s, Leu migrates at tm = 112.1 s, Ile migrates at tm = 113.1 s, Trp migrates at tm = 116.9 s, Met migrates at tm = 119.7 s, Phe migrates at tm = 121.0 s, Val migrates at tm = 124.3 s, His migrates at tm = 126.7 s, Pro migrates at tm = 127.6 s, Thr migrates at tm = 129.1 s, Ser migrates at tm = 131.5 s, Cys migrates at tm = 132.2 s, Ala migrates at tm = 134.8 s, Gly migrates at tm = 136.5 s, Tyr migrates at tm = 176.2 s, Gln migrates at tm = 180.7 s, Asn migrates at tm = 194.6 s, Glu migrates at tm = 207.6 s, and Asp migrates at tm = 214.2 s. The signal threshold (>4σ) was set to 1250 counts. (B) Total photon electropherogram (TPE) showing the photons detected at all Raman shifts as a function of migration time. The concentration of each amino acid in this mixture is 5.0×10⁻⁵ M. The SERS signal generated by the elution of each amino acid in the detection volume persists for less than 500 ms at these concentrations.

References

    1. Dovichi NJ, Hu S. Current Opinion in Chemical Biology. 2003;7:603–608. - PubMed
    1. Jorgenson JW, Lukacs KD. Science. 1983;222:266–272. - PubMed
    1. Ohno K, Tachikawa K, Manz A. Electrophoresis. 2008;29:4443–4453. - PubMed
    1. Squires TM, Quake SR. Reviews of Modern Physics. 2005;77:977–1026.
    1. Fiorini GS, Chiu DT. Biotechniques. 2005;38:429–446. - PubMed

Publication types

MeSH terms