. 2014 Sep 30;5(18):8284-305.
doi: 10.18632/oncotarget.2058.

Transcriptomic profile induced in bone marrow mesenchymal stromal cells after interaction with multiple myeloma cells: implications in myeloma progression and myeloma bone disease

Affiliations

Transcriptomic profile induced in bone marrow mesenchymal stromal cells after interaction with multiple myeloma cells: implications in myeloma progression and myeloma bone disease

Antonio Garcia-Gomez et al. Oncotarget. .

Abstract

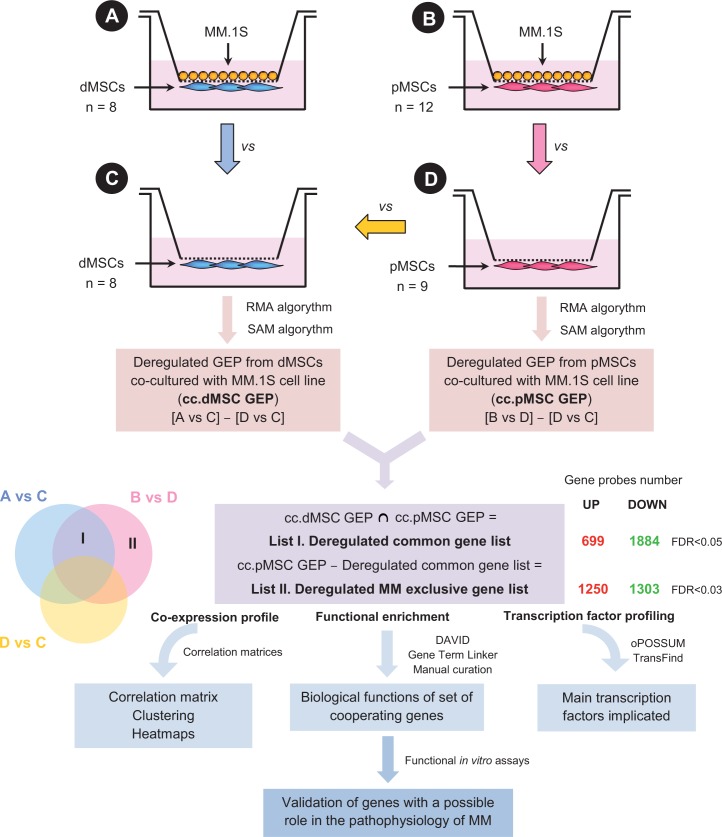
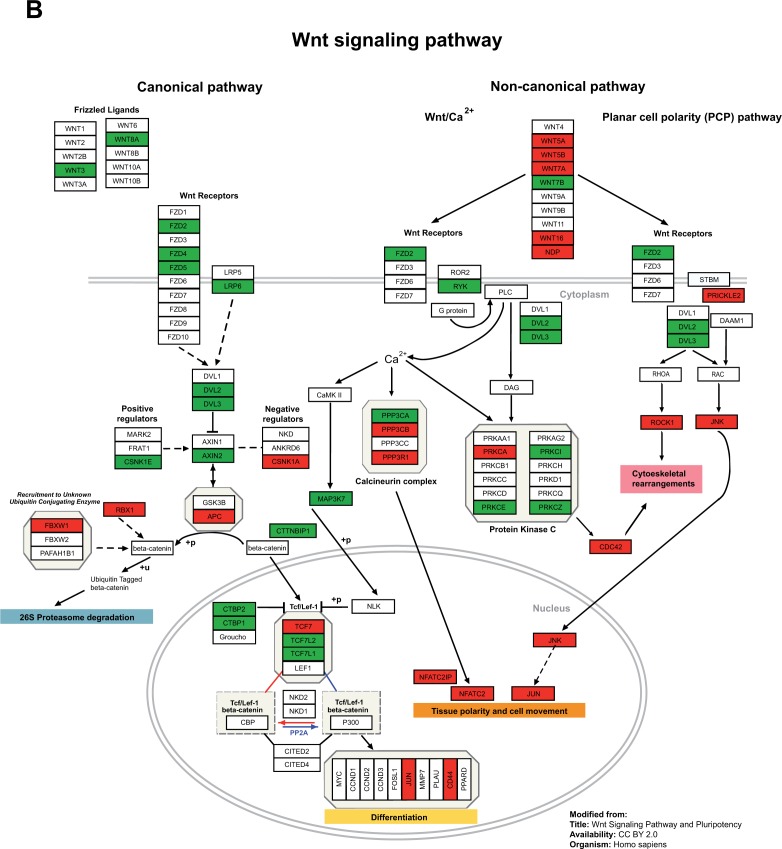
Despite evidence about the implication of the bone marrow (BM) stromal microenvironment in multiple myeloma (MM) cell growth and survival, little is known about the effects of myelomatous cells on BM stromal cells. Mesenchymal stromal cells (MSCs) from healthy donors (dMSCs) or myeloma patients (pMSCs) were co-cultured with the myeloma cell line MM.1S, and the transcriptomic profile of MSCs induced by this interaction was analyzed. Deregulated genes after co-culture common to both d/pMSCs revealed functional involvement in tumor microenvironment cross-talk, myeloma growth induction and drug resistance, angiogenesis and signals for osteoclast activation and osteoblast inhibition. Additional genes induced by co-culture were exclusively deregulated in pMSCs and predominantly associated to RNA processing, the ubiquitine-proteasome pathway, cell cycle regulation, cellular stress and non-canonical Wnt signaling. The upregulated expression of five genes after co-culture (CXCL1, CXCL5 and CXCL6 in d/pMSCs, and Neuregulin 3 and Norrie disease protein exclusively in pMSCs) was confirmed, and functional in vitro assays revealed putative roles in MM pathophysiology. The transcriptomic profile of pMSCs co-cultured with myeloma cells may better reflect that of MSCs in the BM of myeloma patients, and provides new molecular insights to the contribution of these cells to MM pathophysiology and to myeloma bone disease.


Figures

Figure 1
Figure 1. Experimental setting, microarray analysis workflow and subsequent analyses
Graphical representation of the four experimental conditions under consideration: (A) dMSCs in co-culture with MM.1S, (B) pMSCs in co-culture with MM.1S, (C) dMSCs in mono-culture, and (D) pMSCs in mono-culture, which were used to obtain pure MSC populations after the 24 h co-culture. Microarray comparisons were performed to identify deregulated genes in the co-culture condition for dMSCs and pMSCs after exclusion of genes already differentially expressed in dMSCs and pMSCs in mono-culture ([A vs C] - [D vs C] = cc.dMSC GEP, and [B vs D] – [D vs C] = cc.pMSC GEP]). Next, two lists of differentially expressed genes in MSCs after co-culture with MM.1S cells were generated and represented in the Venn diagrams: (i) List I: deregulated genes in co-culture common to dMSCs and pMSCs, and (ii) List II: deregulated genes in co-culture exclusive of pMSCs. Numbers shown indicate genes with are differentially up- or down-regulated with respect to the mono-culture condition in both lists. FDR cut-off value in List II was set up to 0.03 in order to obtain a number of differentially expressed genes equivalent to List I. Both lists of genes (I and II) were the starting point for subsequent bioinformatic analyses as well as functional assays for selected genes outlined below.
Figure 2
Figure 2. Hierarchical clustering of deregulated genes in MSCs due to co-culture with the MM.1S cell line
A, Hierarchical clustering of deregulated genes in co-culture, common to dMSCs and pMSCs (List I, FDR < 0.03). Rows represent individual genes (2583: 699 upregulated and 1884 downregulated), whereas columns refer to each sample (a total of 37 MSC samples from donor or patient origin). The intensity of color saturation in each gene box (ranging from 2 to 14 in a log2 scale) depicts quantitative estimation of its expression level. Red color denotes high expression, increasing in brightness with higher values; green color denotes low expression, increasing brightness with lower values. White color denotes unchanged expression relative to the median expression value for each probeset. Samples are numerated in blue color for dMSCs and red color for pMSCs. B, Hierarchical clustering of deregulated genes in co-culture, exclusive of pMSCs (List II, FDR < 0.02). Rows represent individual genes (2553: 1250 upregulated and 1303 downregulated), whereas columns refer to each sample (a total of 21 pMSC samples, 9 in monoculture and 12 in co-culture). Color scale is the same as in A.
Figure 3
Figure 3. Expression of CXCL1, CXCL5 and CXCL6 by real-time PCR (A-C) and functional activities on myeloma cell proliferation (D), endothelial tube formation (E), migration of OC precursors (F) and MSC-MM cell adhesion (G)
A-C, Expression levels for each gene were evaluated in dMSCs and pMSCs both in mono-culture or after 24 hour co-culture with the MM.1S cell line (n=7 for each type of MSC and culture condition), and normalized to GAPDH levels for each sample. Box plots represent fold-induction of gene expression in the co-culture condition relative to gene expression in mono-culture. D, MM.1S-luc cells were grown in 0.1% FBS containing medium in the presence or absence of specified concentrations of rh CXCL1, CXCL5 and CXCL6, and bioluminescence was measured after 3 days of culture. E, BMEC-1 cells were seeded on a Matrigel surface in medium containing 0.1% FBS and the specified chemokine concentrations for 5 hours. Tubule-like structures were counted under the microscope with the aid of a grid and micrographs are representative of maximal effects observed for each chemokine. F, Migration assays were performed by placing OC precursors in serum-limited conditions in the upper chamber and specified concentrations of rh CXCL1 diluted in the same medium in the lower chamber. Micrographs show representative CXCL1-mediated chemotaxis of OC precursors to the lower chamber after a 6 hour incubation time. G, MM.1S-luc cells were seeded on a monolayer of d/pMSCs in serum-free medium; after 3.5 hours, non-attached cells were removed by gentle PBS washes and bioluminescence signal measured. *p < 0.05.
Figure 4
Figure 4. Expression of NRG3 and NDP (A, D) and functional activities of NRG3 (B, C) and NDP (E-G) in relation to myeloma pathophysiology
A, D, Expression of NRG3 and NDP in dMSCs and pMSCs co-cultured for 24 hours with the MM.1S cell line relative to that in mono-culture as assessed by real-time PCR and normalized to GAPDH levels for each sample (n=7 for each type of MSC and culture condition) *p < 0.05 **p < 0.01 between dMSCs and pMSCs. B, Secreted NRG3 from MM.1S and pMSC direct co-cultures was able to activate the ErbB4 receptor in the SK-N-BE neuroblastoma cell line. Conditioned media (CM) from MM.1S-pMSC direct co-cultures was concentrated ~ 20 fold and added to overnight serum-deprived SK-N-BE cells in the presence or absence of neutralizing anti-NRG3 antibody. After 10 min, protein extracts were immunoprecipitated with the anti-ErbB4 antibody and immunoblotted with an antibody specific for p-Tyr. C, NRG3 shows activity as a myeloma growth factor augmenting the proliferation of the RPMI8226-luc myeloma cell line. The multiple myeloma cell line RPMI8226-luc was cultured in serum-limiting medium (0.1% FBS), half supplemented with concentrated CM from MM.1S-pMSC co-culture with or without neutralizing anti-NRG3 antibody as specified, and bioluminescence measured after 72 hours. E, Recombinant NDP dose-dependently promoted the growth of the RPMI8226-luc cell line grown in serum-limiting conditions (0.1% FBS) for 72 hours. F, NDP induced the formation of tubule-like structures on the BMEC-1 cell line. BMEC-1 cells were seeded on a Matrigel-coated surface in serum-limiting conditions in the presence of specific concentrations of recombinant NDP; after 5 hours, formation of tubule-like structures was assessed. G, PBMCs from healthy donors were cultured in osteoclastogenic medium for 21 days containing M-CSF only, M-CSF and RANKL, or M-CSF and different NDP concentrations; OC formation was quantified by TRAP+ staining of multinucleated (≥ 3 nuclei) cells. *p < 0.05. Representative micrographs are shown.
Figure 5
Figure 5. Expression of CXCL1, CXCL5, CXCL6, WNT5A, IL8, MMP12 (from List I), and NDP, NRG3, ASPM, HMMR (from List II) by real-time PCR in d/pMSCs after co-culture with MM cells and leukemia cell lines
A, Co-cultures of pMSCs (n=3) and primary CD138+ myeloma cells (n=2) were established following the same experimental settings as those with the MM.1S cell line. Expression values for each sample were normalized to GAPDH levels, and the relative expression of the selected genes in pMSCs in the co-culture condition was referred to that in mono-culture arbitrarily set as 1. B, Co-cultures of dMSCs (n=3) and pMSCs (n = 3) with the RPMI-8226, OPM-2 and JJN3 myeloma cell lines were performed in the same manner as those previously established with the MM.1S cell line. After normalization to GAPDH levels, fold-induction in MSCs in the co-culture condition was represented relative to gene expression in mono-culture set as 1 (dashed line). C, In a similar manner, relative expression of the set of genes in MSCs was obtained after co-cultures of dMSCs (n=3) and pMSCs (n=3) with the HEL (erythroleukemia) and MEC-1 (chronic B lymphocytic leukemia) human cell lines. Bars in all graphs illustrate mean values ± SEM.
Figure 6
Figure 6. Schematic representations for deregulated genes in MSCs after interaction with MM.1S cells
A, Predicted network when entering CXCL1, CXCL5 and CXCL6 genes from List I into the GeneMANIA and Cytoscape plugin allowing physical, signaling pathway and co-expression interactions. Node shape is hexagonal for the three query genes and circular for the rest of the predicted nodes of the network, whereas node color is proportional to its average fold change (FC) after co-culture with the MM.1S cell line (brighter red: higher FC after co-culture with respect to monoculture; white: absent in List I). Size of the nodes is indicative of its significance in the predicted network as determined by type and number of interactions. Physical interactions are depicted in blue, signaling pathway interactions in green and co-expression interactions in light gray; the strength of these interactions being indicated by line width. B, Schematic representation of Wnt canonical and non-canonical signaling, modified from www.Wikipathways.org. Upregulated genes on Lists I and II are shown in red, whereas downregulated genes on Lists I and II are coloured in green.

References

    1. Hideshima T, Mitsiades C, Tonon G, Richardson PG, Anderson KC. Understanding multiple myeloma pathogenesis in the bone marrow to identify new therapeutic targets. Nat Rev Cancer. 2007;7:585–598. - PubMed
    1. Podar K, Richardson PG, Hideshima T, Chauhan D, Anderson KC. The malignant clone and the bone-marrow environment. Best Pract Res Clin Haematol. 2007;20:597–612. - PubMed
    1. Basak GW, Srivastava AS, Malhotra R, Carrier E. Multiple myeloma bone marrow niche. Curr Pharm Biotechnol. 2009;10:335–346. - PubMed
    1. Bergfeld SA, DeClerck YA. Bone marrow-derived mesenchymal stem cells and the tumor microenvironment. Cancer Metastasis Rev. 2010;29:249–261. - PubMed
    1. Roccaro AM, Sacco A, Maiso P, Azab AK, Tai YT, Reagan M, Azab F, Flores LM, Campigotto F, Weller E, Anderson KC, Scadden DT, Ghobrial IM. BM mesenchymal stromal cell-derived exosomes facilitate multiple myeloma progression. J Clin Invest. 2013;123:1542–1555. - PMC - PubMed

Publication types

MeSH terms