

Multidimensional poverty in rural Mozambique: a new metric for evaluating public health interventions
- PMID: 25268951
- PMCID: PMC4182519
- DOI: 10.1371/journal.pone.0108654
Multidimensional poverty in rural Mozambique: a new metric for evaluating public health interventions
Abstract
Background: Poverty is a multidimensional phenomenon and unidimensional measurements have proven inadequate to the challenge of assessing its dynamics. Dynamics between poverty and public health intervention is among the most difficult yet important problems faced in development. We sought to demonstrate how multidimensional poverty measures can be utilized in the evaluation of public health interventions; and to create geospatial maps of poverty deprivation to aid implementers in prioritizing program planning.
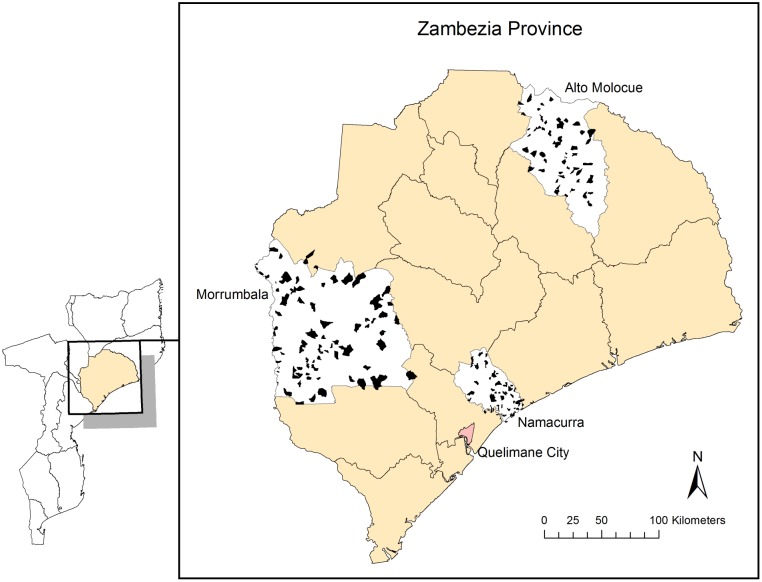
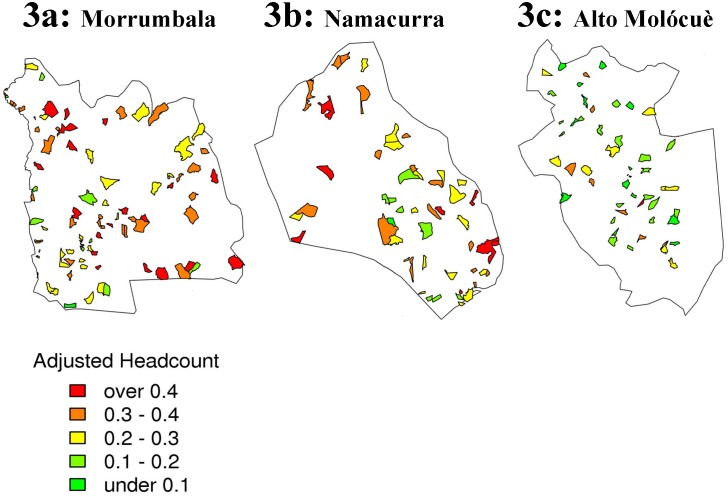
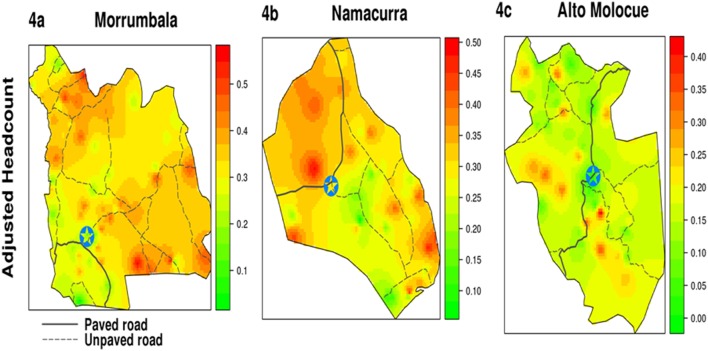
Methods: Survey teams interviewed a representative sample of 3,749 female heads of household in 259 enumeration areas across Zambézia in August-September 2010. We estimated a multidimensional poverty index, which can be disaggregated into context-specific indicators. We produced an MPI comprised of 3 dimensions and 11 weighted indicators selected from the survey. Households were identified as "poor" if were deprived in >33% of indicators. Our MPI is an adjusted headcount, calculated by multiplying the proportion identified as poor (headcount) and the poverty gap (average deprivation). Geospatial visualizations of poverty deprivation were created as a contextual baseline for future evaluation.
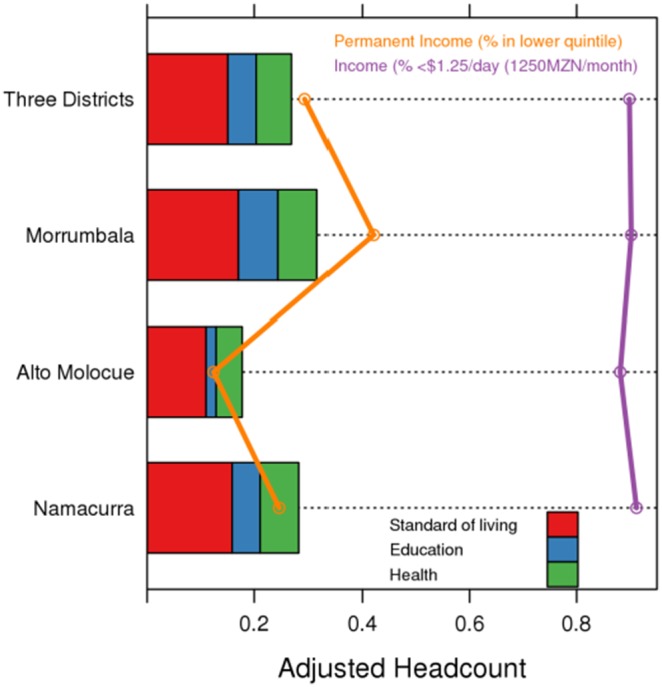
Results: In our rural (96%) and urban (4%) interviewees, the 33% deprivation cut-off suggested 58.2% of households were poor (29.3% of urban vs. 59.5% of rural). Among the poor, households experienced an average deprivation of 46%; thus the MPI/adjusted headcount is 0.27 ( = 0.58×0.46). Of households where a local language was the primary language, 58.6% were considered poor versus Portuguese-speaking households where 73.5% were considered non-poor. Living standard is the dominant deprivation, followed by health, and then education.
Conclusions: Multidimensional poverty measurement can be integrated into program design for public health interventions, and geospatial visualization helps examine the impact of intervention deployment within the context of distinct poverty conditions. Both permit program implementers to focus resources and critically explore linkages between poverty and its social determinants, thus deriving useful findings for evidence-based planning.
Conflict of interest statement
Figures
References
-
- The United Nations Development Agenda: Development for all. Available: http://www.un.org/esa///devagenda/UNDA_BW5_Final.pdf. Accessed 2014 Sep 5.
-
- Fanzo JC, Pronyk PM (2011) A review of global progress toward the Millennium Development Goal 1 Hunger Target. Food Nutr Bull 32: 144–158. - PubMed
-
- Dodd R, Cassels A (2006) Health, development and the Millennium Development Goals. Ann Trop Med Parasitol 100: 379–387. - PubMed
-
- Anand S, Sen A Concepts of human development and poverty: A multidimensional perspective. Available: http://clasarchive.berkeley.edu/Academics/courses/center/fall2007/sehnbr.... Accessed 2014 Sep 5.
Publication types
MeSH terms
LinkOut - more resources
Full Text Sources
Other Literature Sources
Medical
Miscellaneous
