

R-flurbiprofen attenuates experimental autoimmune encephalomyelitis in mice
- PMID: 25269445
- PMCID: PMC4237468
- DOI: 10.15252/emmm.201404168
R-flurbiprofen attenuates experimental autoimmune encephalomyelitis in mice
Abstract
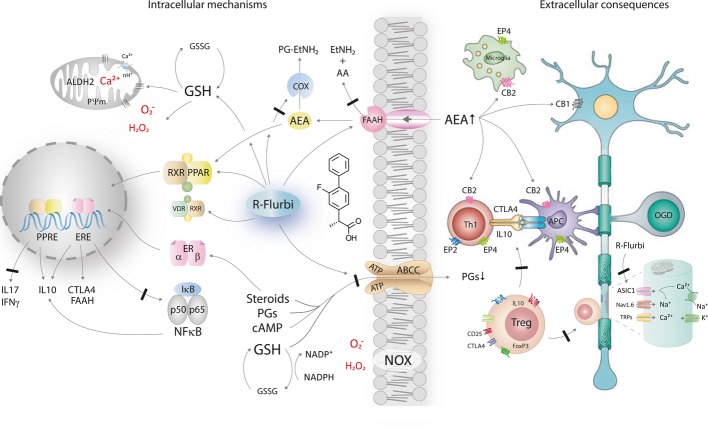
R-flurbiprofen is the non-cyclooxygenase inhibiting R-enantiomer of the non-steroidal anti-inflammatory drug flurbiprofen, which was assessed as a remedy for Alzheimer's disease. Because of its anti-inflammatory, endocannabinoid-modulating and antioxidative properties, combined with low toxicity, the present study assessed R-flurbiprofen in experimental autoimmune encephalomyelitis (EAE) models of multiple sclerosis in mice. Oral R-flurbiprofen prevented and attenuated primary progressive EAE in C57BL6/J mice and relapsing-remitting EAE in SJL mice, even if the treatment was initiated on or after the first flare of the disease. R-flurbiprofen reduced immune cell infiltration and microglia activation and inflammation in the spinal cord, brain and optic nerve and attenuated myelin destruction and EAE-evoked hyperalgesia. R-flurbiprofen treatment increased CD4(+)CD25(+)FoxP3(+) regulatory T cells, CTLA4(+) inhibitory T cells and interleukin-10, whereas the EAE-evoked upregulation of pro-inflammatory genes in the spinal cord was strongly reduced. The effects were associated with an increase of plasma and cortical endocannabinoids but decreased spinal prostaglandins, the latter likely due to R to S inversion. The promising results suggest potential efficacy of R-flurbiprofen in human MS, and its low toxicity may justify a clinical trial.
Keywords: endocannabinoids; multiple sclerosis; optic neuritis; pain; regulatory T cells.
© 2014 The Authors. Published under the terms of the CC BY 4.0 license.
Figures
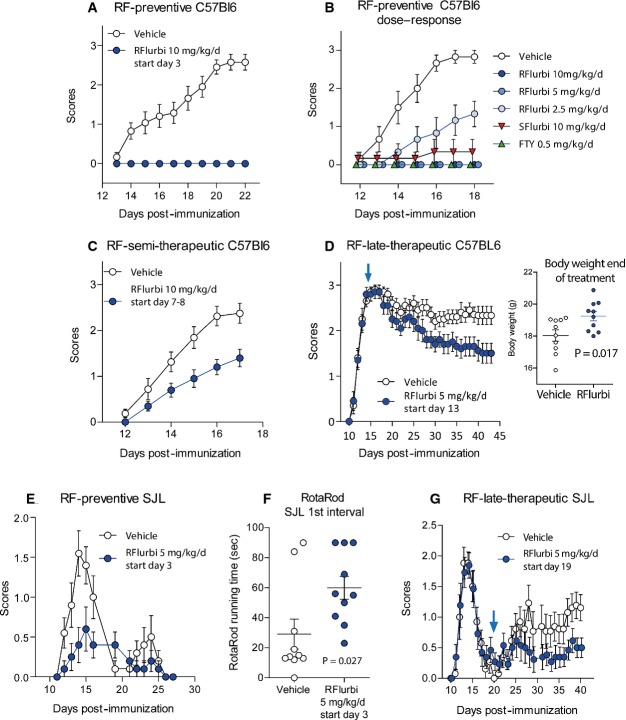
EAE scores in C57BL6/J mice on preventive treatment with R-flurbiprofen (10 mg/kg/day) or vehicle. Treatment started 3 days after immunization and was continuously administered in the drinking water (n = 12 per group, rm-ANOVA for ‘treatment’ P = 3.691E-8).
Dose response of EAE scores in C57BL6/J mice treated from 3 days after immunization with vehicle, R-flurbiprofen (2.5, 5, and 10 mg/kg/day), S-flurbiprofen (10 mg/kg/day) and FTY720 (0.5 mg/kg/day), all continuously administered in the drinking water (n = 6 per group, rm-ANOVA for ‘treatment’ with Dunnett post hoc versus vehicle, P < 0.0001 for all treatment groups and time points ≥ 14 days after immunization).
EAE scores in C57BL6/J mice on semi-therapeutic treatment with R-flurbiprofen (10 mg/kg/day) or vehicle. Treatment started 3–4 days before onset of clinical scores, that is, 7–8 after immunization. (n = 10 per group, rm-ANOVA for ‘treatment’ P = 0.0085).
EAE scores in C57BL6/J mice on late-therapeutic treatment with R-flurbiprofen (5 mg/kg/day) or vehicle. Treatment started after full development of the disease 13 days after immunization (the arrow indicates the start of treatment). Animals were allocated as score-matched pairs to the vehicle or R-flurbiprofen group. R-flurbiprofen or vehicle was administered via drug or vehicle soaked sweet cornflakes (n = 10 per group, rm-ANOVA for ‘time × treatment’ Greenhouse-Geisser adjusted, P = 0.008). The insert in (D) shows the mean body weight of the last 3 treatment days (n = 10 per group, two-sided unpaired Student's t-test, P = 0.017).
EAE scores on preventive treatment with R-flurbiprofen (5 mg/kg/day) or vehicle. Treatment started 3 days after immunization and was continuously administered in the drinking water (n = 10 per group, rm-ANOVA for ‘treatment’, P = 0.0034).
Running time in the Rota Rod test during the 1st interval in SJL mice treated with vehicle or R-flurbiprofen from day 3 onwards (5 mg/kg/day) (n = 10, unpaired two-sided Student's t-test, P = 0.027).
EAE scores in SJL mice on late-therapeutic treatment with R-flurbiprofen (5 mg/kg/day) or vehicle. Treatment started on day 19, that is, after the first disease flare (arrow indicates the start). Animals were allocated to the treatment groups as score-matched pairs based on the severity of the first flare of the disease. Only mice with scores ≥ 1 were included, namely, 70% of all mice (n = 13 for the treatment period, n = 20 were immunized, rm-ANOVA for ‘time × treatment’, P = 0.0125).

Nociceptive sensitivity on heat stimulation in the hot plate test in C57BL6/J mice (n = 10, rm-ANOVA for ‘treatment’, P = 0.0107, post hoc P-values *10.045, *20.024, *30.003).
Nociceptive sensitivity on mechanical stimulation in the Dynamic Plantar test in C57BL6/J mice (n = 10, rm-ANOVA for ‘treatment’, P = 0.0008, post hoc P-values *10.0034, *20.0008, *30.0142).
Nociceptive sensitivity on cold stimulation in the acetone test in C57BL6/J mice (n = 10, rm-ANOVA, post hoc *P = 0.0354).
Nociceptive sensitivity on heat stimulation in the tail flick test in C57BL6/J mice (n = 10).
Nociceptive sensitivity on heat stimulation in the Hargreaves test in SJL mice (n = 6, unpaired two-sided Student's t-test for treatment period, *P = 0.048).
Nociceptive sensitivity on heat stimulation in the tail flick test in SJL mice (n = 6, unpaired two-sided Student's t-test for treatment period, *P = 0.034).
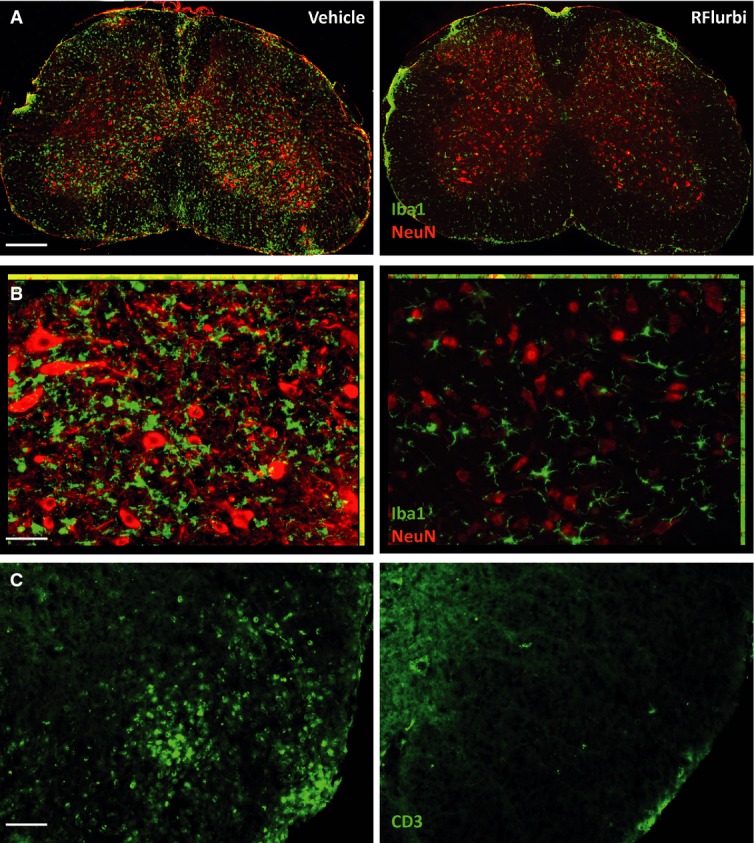
Immunofluorescence of ionized calcium binding adaptor molecule 1 (Iba-1, green) in microglia and macrophages. Neurons were counterstained with the neuronal marker NeuN in red. Scale bar 200 μm.
Higher magnification of (A). Scale bar 50 μm.
Immunofluorescence of the T-cell marker CD3 in the white matter of the lumbar spinal cord. Scale bars 50 μm.
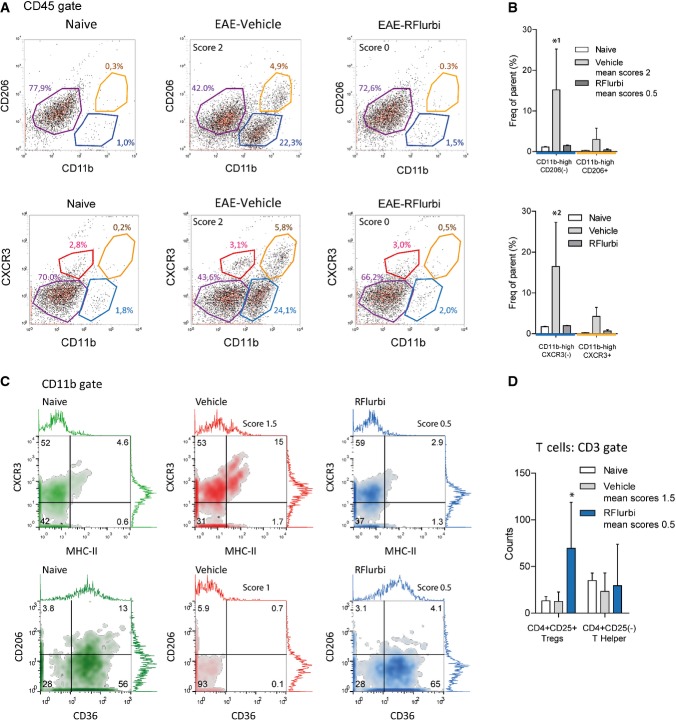
Exemplary scatter dot plots of CD45+ cells, subsequently gated for CD11b versus CD206 (marker for M2-like microglia/macrophages) and CD11b versus CXCR3 (high in microglia). CD11b-high cells were increased in the vehicle group, but not in R-flurbiprofen treated mice.
Quantitative results of the blue and yellow gates of (A). (n = 3, two-way ANOVA, post hoc Bonferroni versus naïve for ‘treatment’ P-values *10.0093, *20.005).
Exemplary density plots of CD11b+ cells subsequently gated for MHC-II (marker for antigen presenting cells) versus CXCR3 and CD36 (scavenger receptor class B, marker for M2-like) versus CD206. CD36+ M2-like cells were strongly reduced in the vehicle group.
Quantitative result for CD3+ T cells subsequently gated for CD4 versus CD25. CD4+CD25+ T cells (likely to be Tregs) were higher in the R-flurbiprofen group (n = 5, two-way ANOVA, post hoc Dunnett versus naïve for ‘treatment’ *P = 0.0056).
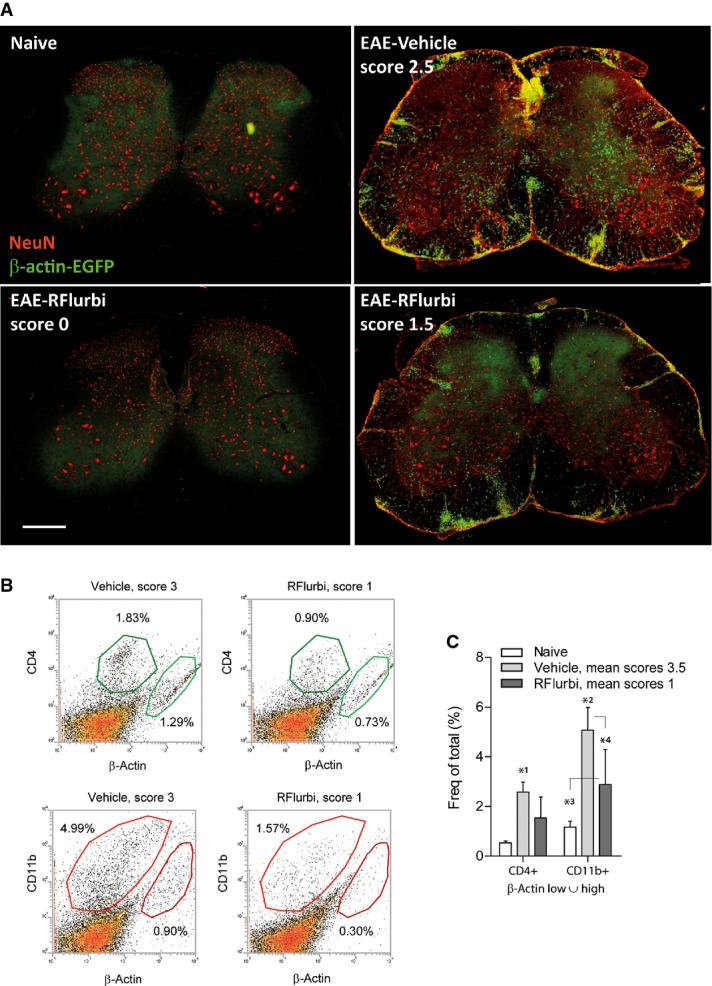
Immunofluorescence of β-actin-EGFP positive infiltrating cells (green). Neurons were counterstained with the neuronal marker NeuN (red). Scale bars 200 μm. Two extreme examples of the R-flurbiprofen treated group with complete and moderate efficacy are shown.
Scatter dot plots of the FACS analysis of β-actin-EGFP positive infiltrating T cells (CD4+) and myeloid cells (CD11b+).
Quantitative results of the ‘β-actin low or high’ gate. Myeloid cell infiltrates were significantly reduced in the R-flurbiprofen group. Further quantitative results are given in Supplementary Table S4. The asterisks indicate statistically significant differences versus naïve and as indicated (two-way ANOVA, post hoc Bonferroni for ‘treatment’, n = 5 per group, P-values *10.0113, *20.000962, *30.0422, *40.0059).
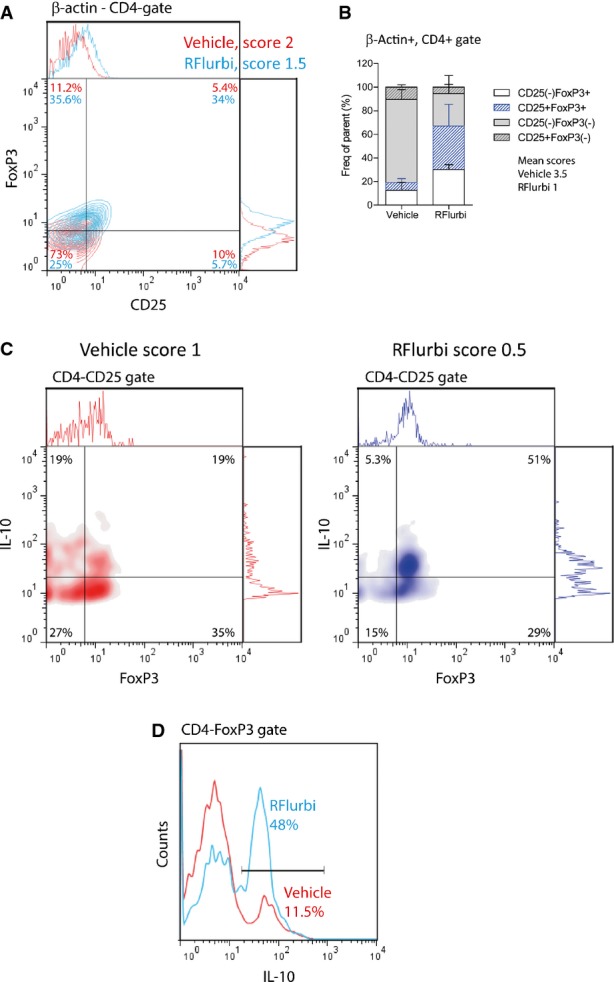
The BMX from β-actin-EGFP mice was done 3 weeks before immunization. Treatment started 3 days after immunization, and spleens were dissected out during the flare of the disease, day 16. Score-matched pairs were analyzed to assess effects on T-cell subpopulations. Infiltrating T-helper cells were identified as being β-actin+CD4+ and were subsequently gated for CD25 versus FoxP3 to identify Tregs (CD25+FoxP3+).
Quantitative analysis of CD4+CD25+FoxP3 Tregs (blue bars). (n = 4 mice, two-way ANOVA ‘population × treatment’ Greenhouse-Geisser P = 0.003. Further quantitative results are given in Supplementary Table S5.
Density plots of CD4+CD25+ splenocytes from C57Bl6/J mice with EAE and semi-therapeutic treatment with vehicle or R-flurbiprofen (10 mg/kg/day, drinking water). Spleens were dissected out during the flare, day 18. CD4+CD25+ were subsequently gated for IL-10 versus FoxP3.
IL-10 histogram of CD4+FoxP3+ splenocytes from the same mice. Quantitative results are given in Supplementary Table S6.
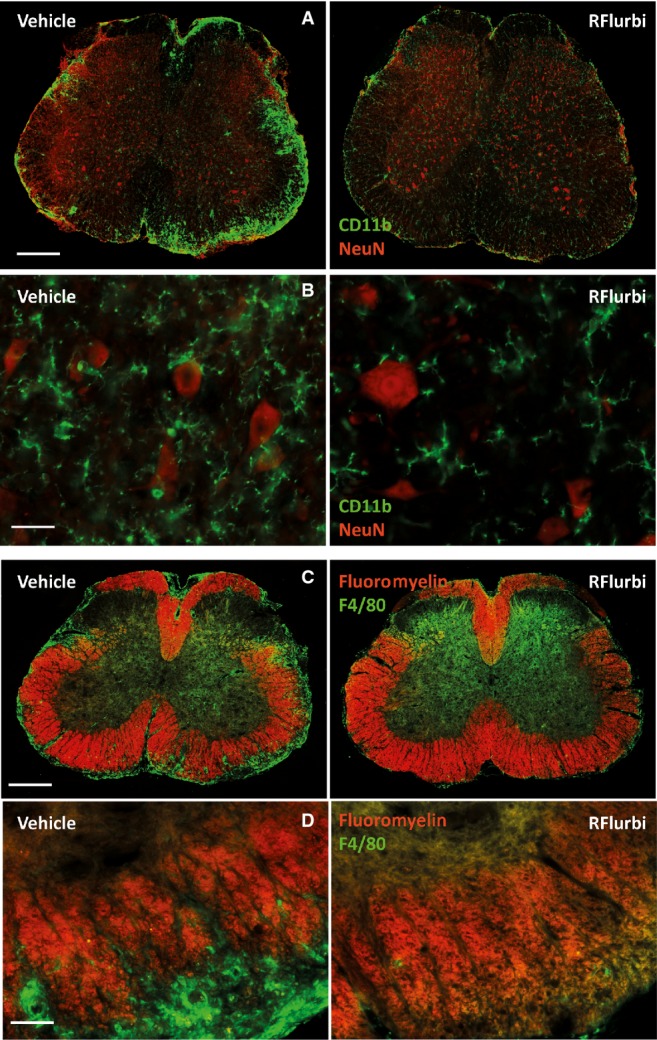
CD11b immunoreactive macrophages and microglia (green) in vehicle and R-flurbiprofen treated mice. Neurons were counterstained with the neuronal marker NeuN (red). Scale bar 200 μm.
Higher magnification of A of the gray matter of the ventral horn. Scale bar 50 μm.
Immunofluorescence of myelin (fluoromyelin, red) and macrophages (F4/80, green) in vehicle and R-flurbiprofen treated mice. Scale bar 200 μm.
Higher magnification of C of the ventral horn. Scale bar 50 μm.

Scatter dot plot of CD3+, CD4+ and CD8+ T cells (two-way ANOVA for ‘treatment’ P = 0.0003, post hoc for each population P-values *10.0015, *20.0281, *30.0104).
Scatter dot plot of CD25+ cells. R-flurbiprofen significantly increased the frequency of CD8+CD25+ and of CD4+CD25+ regulatory T cells (two-way ANOVA for ‘treatment’ P = 0.0047, post hoc for each population P-values *10.0013, *20.0267).
Intracellular cytokines of n = 3 mice per treatment group after ex vivo restimulation with PMA/ionomycin. IFNγ and IL17A positive cells were reduced in the R-flurbiprofen group (two-way ANOVA for ‘treatment’ P = 0.0102, post hoc for each cytokine P-values *10.0009, *20.0262, *30.0359).
Exemplary contour plots of CD8+CD152/CTLA4+ cells. CD152/CTLA4 is a marker for T cells that down-regulate an activated immune system.
Exemplary contour plots of CD4+CD152/CTLA4+ cells.
Quantitative results for CD152/CTLA4 positive cells. R-flurbiprofen significantly increased CD3+CD8+CD152+ and CD3+CD4+CD152+ cells [two-way ANOVA (population and treatment) for ‘treatment’ P = 0.0035, post hoc for each population P-values *10.0003, *20.0033, further quantitative results in Supplementary Table S7].
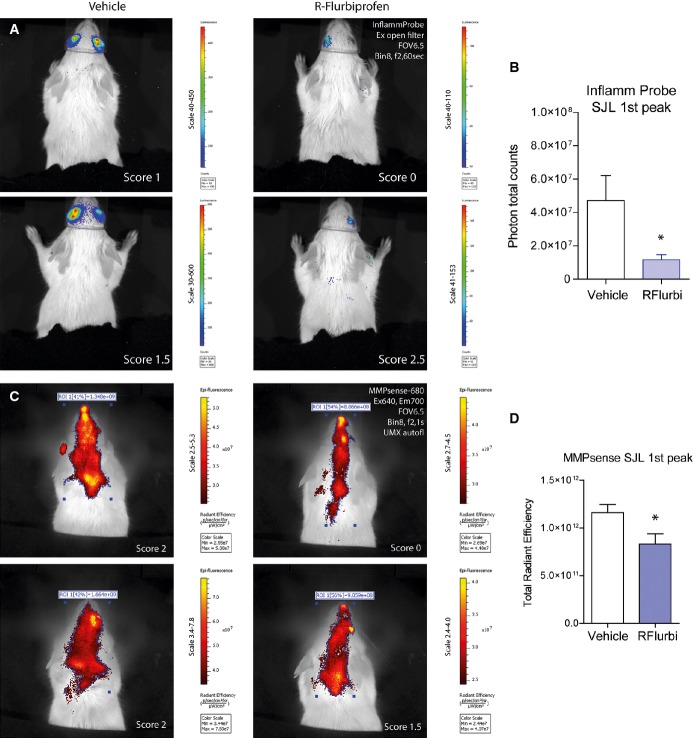
Bioluminescent images of optic neuritis captured 10 min after i.p. injection of the Inflammation Probe (2 examples of n = 8). Treatment started 5 days after immunization.
Quantification of total photon counts of the Inflammation Probe in regions of interest (unpaired two-sided Student's t-test, *P = 0.0255).
Epi-fluorescent unmixed images of brain and spinal cord inflammation captured 24 h after intravenous injection of the near-infrared MMPsense-680 probe (2 examples of n = 8). Treatment started 3 days after immunization.
Quantification of total radiant efficiency of MMPsense after spectral unmixing of autofluorescence (unpaired two-sided Student's t-test, *P = 0.0273).
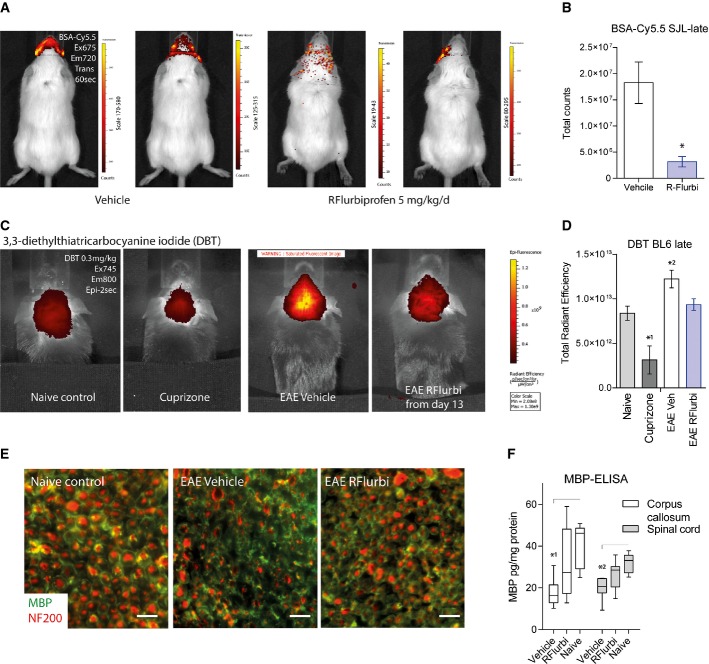
In vivo imaging of blood-brain barrer disruption 4–6 h after intravenous injection of Cy5.5-labeled BSA in SJL mice treated with vehicle or R-flurbiprofen (5 mg/kg/day) from day 19 after immunization onwards. Mice were imaged during the 3rd remission. Cy5.5-labeled BSA accumulates in the brain only if the permeability of the BBB is pathologically increased.
Quantitative results for the total fluorescent counts of BSA-Cy5.5 in regions of interest (n = 2 mice, 3 time points each, unpaired two-sided Student's t-test, *P = 0.0006).
Representative in vivo near-infrared fluorescence (NIRF) images of the myelin-binding dye, DBT in the brain of a naive C57BL6 mouse, a mouse treated with the demyelination agent, cuprizone for 6 weeks and in brains of EAE mice treated from day 13 after immunization with vehicle or R-flurbiprofen (5 mg/kg/day) for 26 days.
Quantitative results for the total radiant efficiency of DBT NIRF signals in the region of interest (n = 4 mice per group). Univariate ANOVA with Bonferroni post hoc analysis versus naive *10.0213, *20.0136.
Immunofluorescence analysis of the optic nerve in naïve mice and in EAE mice (C57BL6/J) treated with vehicle or R-flurbiprofen (10 mg/kg/day, drinking water) from the 5th day after immunization. Myelin was immunostained with anti-myelin basic protein (MBP, green), and axons were counterstained with anti-neurofilament 200 (NF200, red). Representative images of n = 3 mice per group. Scale bars are 20 μm.
Quantitative analysis of myelin basic protein (MBP) levels in the corpus callosum and spinal cord using an enzyme immune assay in naïve mice and in C57BL6/J EAE mice treated from day 13 after immunization with vehicle or R-flurbiprofen (5 mg/kg/day) for 28 days (n = 7 per group). Two-way ANOVA (‘region’ and ‘treatment’) P = 0.0002 for ‘treatment’, post hoc analysis *10.0022, *20.0089).
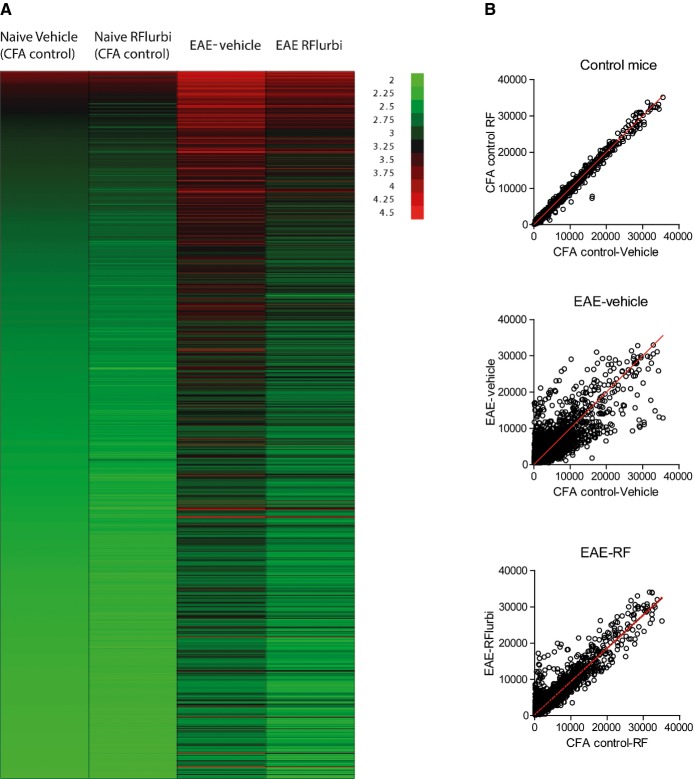
Heat map of log transformed mRNA expression of genes, which were upregulated ≥ twofold in the EAE-vehicle group (green low intensity, red high intensity).
Scatter plots of mRNA intensities. CFA control mice (no EAE) treated with vehicle or R-flurbiprofen (top), vehicle treated CFA control mice versus vehicle treated EAE mice (middle) and R-flurbiprofen treated CFA control mice versus R-flurbiprofen treated EAE mice (bottom).
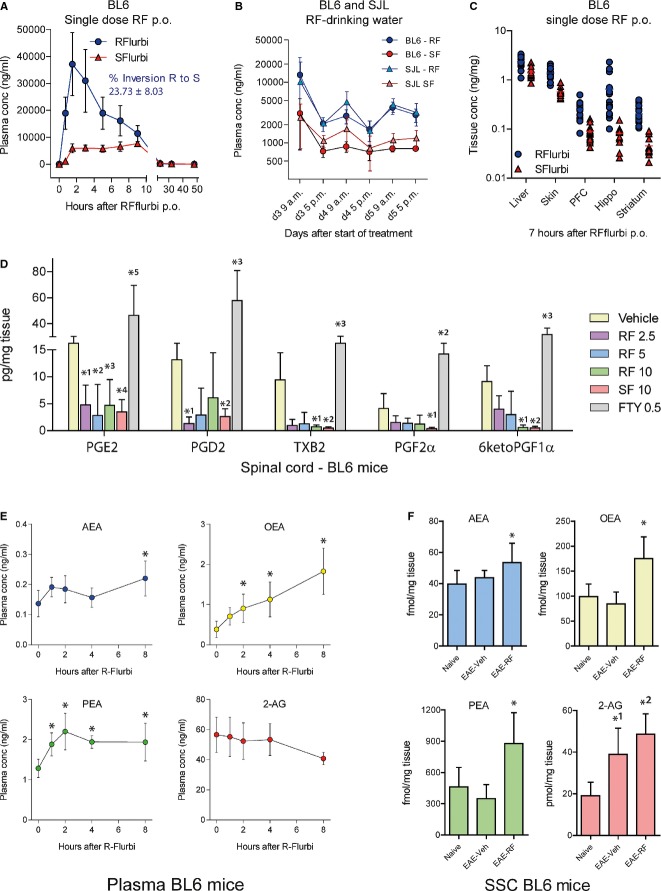
Plasma concentration versus time courses in C57BL6/J mice (n = 14) after a single oral dose of 10 mg/kg R-flurbiprofen. The rates of R to S inversion in (A) and (B) were calculated on the basis of the AUCs up to 8 h.
Comparison of the circadian rhythms of R- and S-flurbiprofen plasma concentrations in C57BL6/J and SJL mice receiving continuous R-flurbiprofen (10 mg/kg/day) in the drinking water (n = 5 per group).
Tissue concentrations of R-and S-flurbiprofen in C57BL6/J mice in liver, skin and three brain regions (PFC, prefrontal cortex; Hippo, hippocampus) 7 h after a single oral dose of 10 mg/kg R-flurbiprofen (n = 14).
Prostaglandin concentrations in the spinal cord of C57BL6/J mice in the EAE model. The mice received preventive treatment with vehicle, R-flurbiprofen (2.5, 5, 10 mg/kg/day), S-flurbiprofen (10 mg/kg/day) or FTY (0.5 mg/kg/day) from the 3rd day after immunization, and the tissue was dissected out during the flare of the disease, day 20. (n = 6 per group, two-way ANOVA (‘lipid’ and ‘treatment’) with subsequent Dunnett post hoc analyses versus vehicle. P-values of post hoc tests PGE2: *10.0014, *20.0002, *30.0013, *40.0004, *50.0001; PGD2: *10.0275, *20.050, *30.0001; TXB2: *10.0405, *20.0351, *30.0024; PGF2α: *10.0395, *2 0.0172; 6ketoPGF1α: *10.0440, *20.0428, *30.0001).
Endocannabinoid concentrations in plasma of C57BL6/J mice before and after receiving a single i.p. injection of 10 mg/kg R-flurbiprofen during the flare of EAE (n = 5). rm-ANOVA within subject factor ‘time’ for AEA P = 0.0061, OEA P = 0.0001, PEA P = 0.0010, 2-AG 0.0016. The asterisks indicate those time points that differed significantly versus baseline.
Endocannabinoid concentrations in the somatosensory cortex (SSC) of naïve and EAE mice (C57BL6/J) treated continuously with vehicle or R-flurbiprofen (10 mg/kg/day in drinking water) from the 3rd day after immunization (n = 13 per group). The tissue was dissected out during the flare of the disease, day 20 (univariate ANOVA with post hoc Bonferroni for AEA: *P = 0.020; OEA: *P = 0.000052; PEA: *P = 0.000412; 2-AG: *1P =0.0002, *2P = 0.00003).
References
-
- Arun T, Tomassini V, Sbardella E, de Ruiter MB, Matthews L, Leite MI, Gelineau-Morel R, Cavey A, Vergo S, Craner M, et al. Targeting ASIC1 in primary progressive multiple sclerosis: evidence of neuroprotection with amiloride. Brain. 2013;136:106–115. - PubMed
-
- Ayoub SS, Wood EG, Hassan SU, Bolton C. Cyclooxygenase expression and prostaglandin levels in central nervous system tissues during the course of chronic relapsing experimental autoimmune encephalomyelitis (EAE) Inflamm Res. 2011;60:919–928. - PubMed
Publication types
MeSH terms
Substances
LinkOut - more resources
Full Text Sources
Other Literature Sources
Medical
Molecular Biology Databases
Research Materials
