Prognostic and therapeutic relevance of molecular subtypes in high-grade serous ovarian cancer
- PMID: 25269487
- PMCID: PMC4271115
- DOI: 10.1093/jnci/dju249
Prognostic and therapeutic relevance of molecular subtypes in high-grade serous ovarian cancer
Abstract
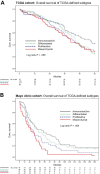
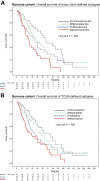
Molecular classification of high-grade serous ovarian cancer (HGSOC) using transcriptional profiling has proven to be complex and difficult to validate across studies. We determined gene expression profiles of 174 well-annotated HGSOCs and demonstrate prognostic significance of the prespecified TCGA Network gene signatures. Furthermore, we confirm the presence of four HGSOC transcriptional subtypes using a de novo classification. Survival differed statistically significantly between de novo subtypes (log rank, P = .006) and was the best for the immunoreactive-like subtype, but statistically significantly worse for the proliferative- or mesenchymal-like subtypes (adjusted hazard ratio = 1.89, 95% confidence interval = 1.18 to 3.02, P = .008, and adjusted hazard ratio = 2.45, 95% confidence interval = 1.43 to 4.18, P = .001, respectively). More prognostic information was provided by the de novo than the TCGA classification (Likelihood Ratio tests, P = .003 and P = .04, respectively). All statistical tests were two-sided. These findings were replicated in an external data set of 185 HGSOCs and confirm the presence of four prognostically relevant molecular subtypes that have the potential to guide therapy decisions.
© The Author 2014. Published by Oxford University Press. All rights reserved. For Permissions, please e-mail: journals.permissions@oup.com.
Figures


Comment in
-
Molecular subtypes of high-grade serous ovarian cancer: the holy grail?J Natl Cancer Inst. 2014 Sep 30;106(10):dju297. doi: 10.1093/jnci/dju297. Print 2014 Oct. J Natl Cancer Inst. 2014. PMID: 25269490 No abstract available.
References
-
- Siegel R, Naishadham D, Jemal A. Cancer statistics, 2013. CA Cancer J Clin. 2013;63(1):11–30. - PubMed
-
- Yap TA, Carden CP, Kaye SB. Beyond chemotherapy: targeted therapies in ovarian cancer. Nat Rev Cancer. 2009;9(3):167–181. - PubMed
-
- Tothill RW, Tinker AV, George J, et al. Novel molecular subtypes of serous and endometrioid ovarian cancer linked to clinical outcome. Clin Cancer Res. 2008;14(16):5198–5208. - PubMed
-
- Cannistra SA. Cancer of the ovary. N Engl J Med. 2004;351(24):2519–2529. - PubMed
Publication types
MeSH terms
Substances
Grants and funding
LinkOut - more resources
Full Text Sources
Other Literature Sources
Medical
Molecular Biology Databases

