

Development and impact of the Iranian hospital performance measurement program
- PMID: 25269656
- PMCID: PMC4263047
- DOI: 10.1186/1472-6963-14-448
Development and impact of the Iranian hospital performance measurement program
Abstract
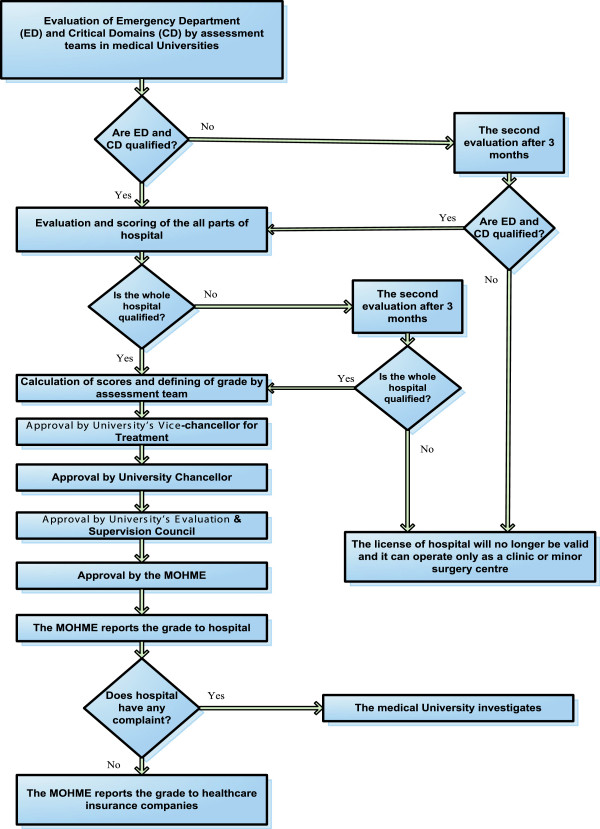
Background: Iran developed a national hospital performance measurement program (HPMP) which has been implemented annually throughout its hospitals since 1997. However, little is known yet about its development and the impact of the program on hospital performance.This study aims to describe the development and process of implementation of the HPMP, and to explore the impact on hospital performance by looking at the trends of performance scores of all different types of Iranian hospitals.
Methods: This was a mixed method study consisting of longitudinal data and qualitative document analysis. Hospital performance data over the period of 2002 to 2008 was analysed.
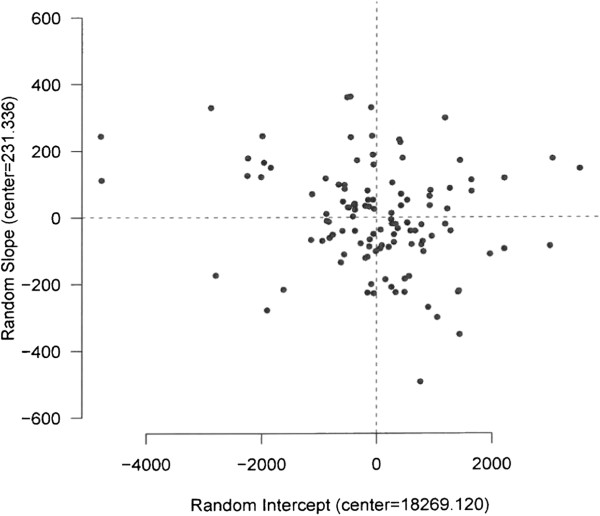
Results: Iran instituted a comprehensive HPMP and implemented it in all hospitals since 1997. The program followed a phased development to stimulate performance and quality improvement in hospitals. Overall, the program has had a positive impact on the performance of general and specialized hospitals. The performance of general hospitals did not appear to be associated with their size or affiliated university ranking. However, the rate of performance improvement of general teaching and private hospitals was significantly lower than the average improvement rate of all general hospitals. There was no relationship between teaching status of the specialized hospitals and their level of performance. However, the performance of the governmental specialized hospitals showed a substantial decline over time. Moreover, among specialized hospitals, the bigger sized and those affiliated with higher ranked universities, reported better performance.
Conclusions: Overall, the development and implementation of an obligatory HPMP in Iran has improved the level of performance in general and specialized hospitals. However, there is room for further performance improvement especially in the general teaching, private, and governmental specialized hospitals. Reconsidering the ownership type, funding mechanisms and responsibility for the HPMP may have an impact on the absolute level of performance and improvement capacity of hospitals. In addition, the role and composition of survey teams, mechanism of implementation according to the characteristics of hospitals, and updating standards are important factors to promote performance improvement and hospital accreditation requirements.
Figures
References
-
- Rooney AL, van Ostenberg PR. Licensure, Accreditation, and Certification: Approaches to Health Services Quality. USA: Center for Human Services (CHS), Quality Assurance Project; 1999. Quality Assurance Methodology Refinement Series.
-
- Shih A, Schoenbaum SC. Measuring Hospital Performance: The Importance of Process Measures. 2007. Data brief, The Commonwealth Fund.
-
- Shaw C. Health Evidence Network report. Copenhagen: WHO Regional Office for Europe; 2003. How Can Hospital Performance Be Measured and Monitored?
-
- Nutley S, Smith PC. League tables for performance improvement in health care. J Health Serv Res Policy. 1998;3:50–57. - PubMed
Pre-publication history
-
- The pre-publication history for this paper can be accessed here: http://www.biomedcentral.com/1472-6963/14/448/prepub
Publication types
MeSH terms
LinkOut - more resources
Full Text Sources
Other Literature Sources
Medical
