Comparative Study
. 2015 Jun;26(6):1389-401.
doi: 10.1681/ASN.2014020190. Epub 2014 Sep 30.

MicroRNA-193a Regulates the Transdifferentiation of Human Parietal Epithelial Cells toward a Podocyte Phenotype

Affiliations
Comparative Study

MicroRNA-193a Regulates the Transdifferentiation of Human Parietal Epithelial Cells toward a Podocyte Phenotype

Leonie Kietzmann et al. J Am Soc Nephrol. 2015 Jun.

Abstract

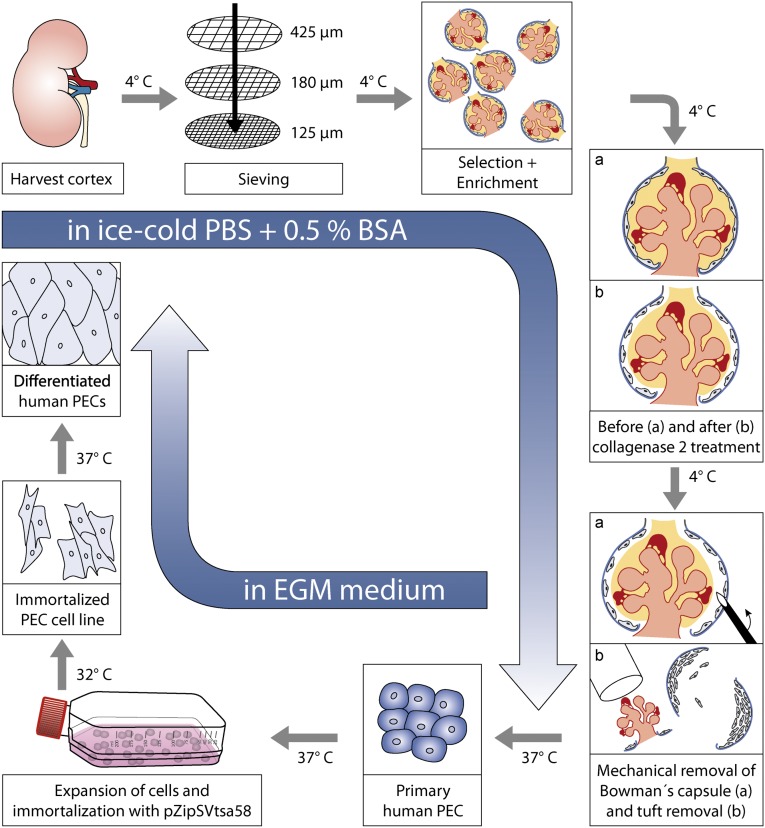
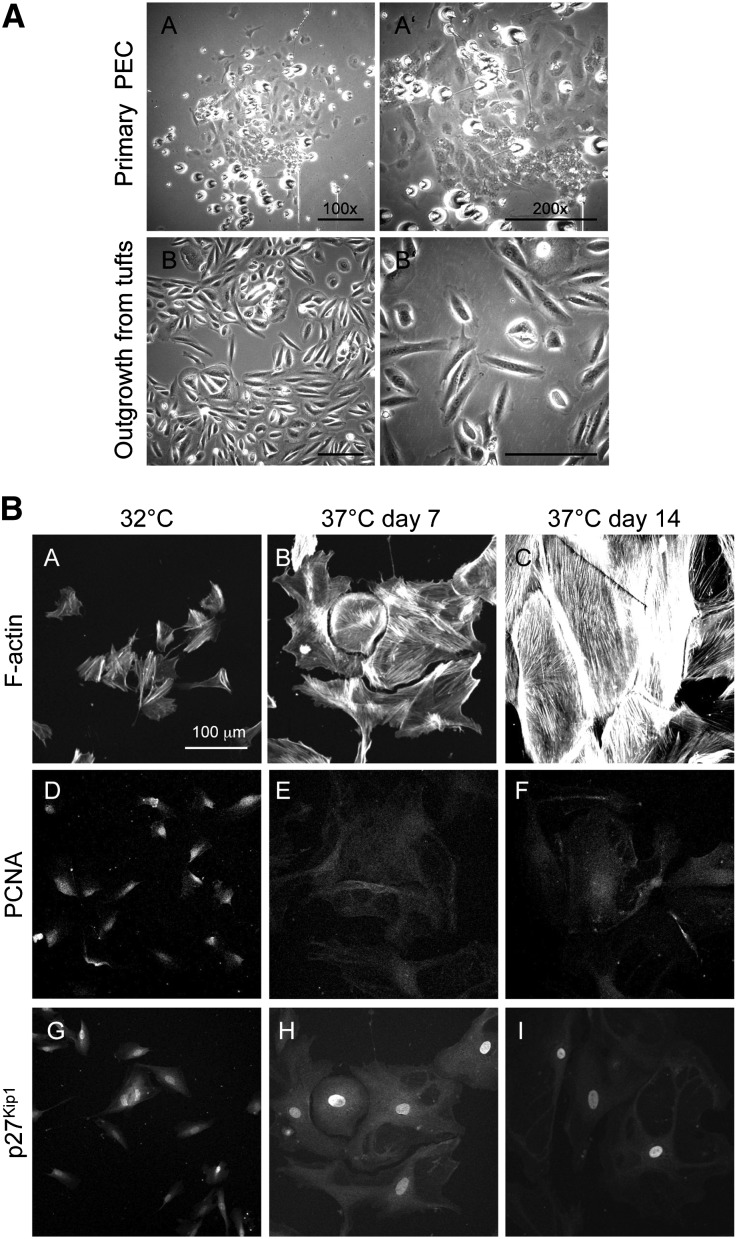
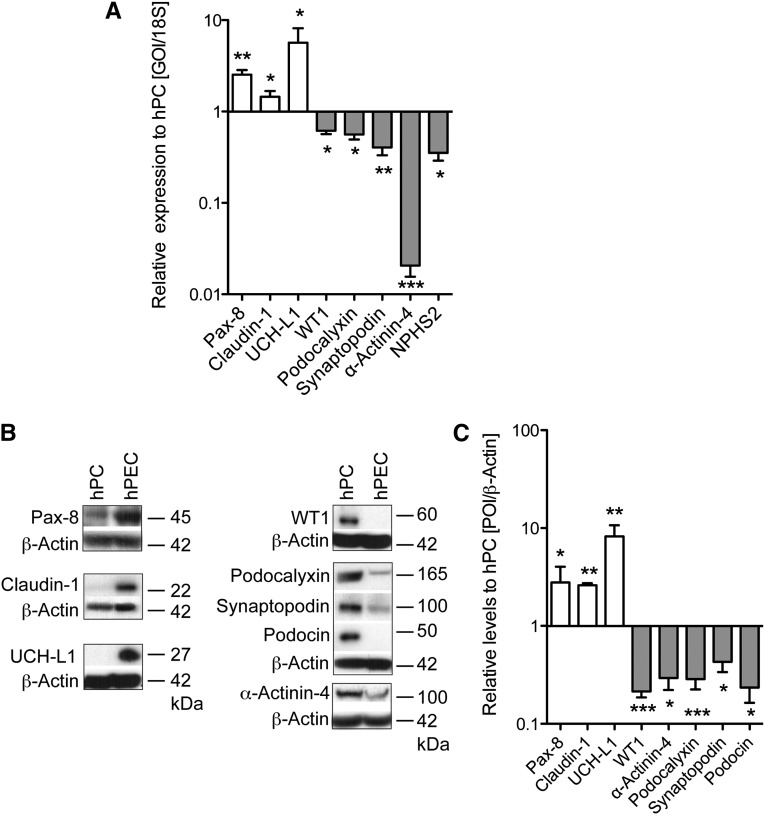
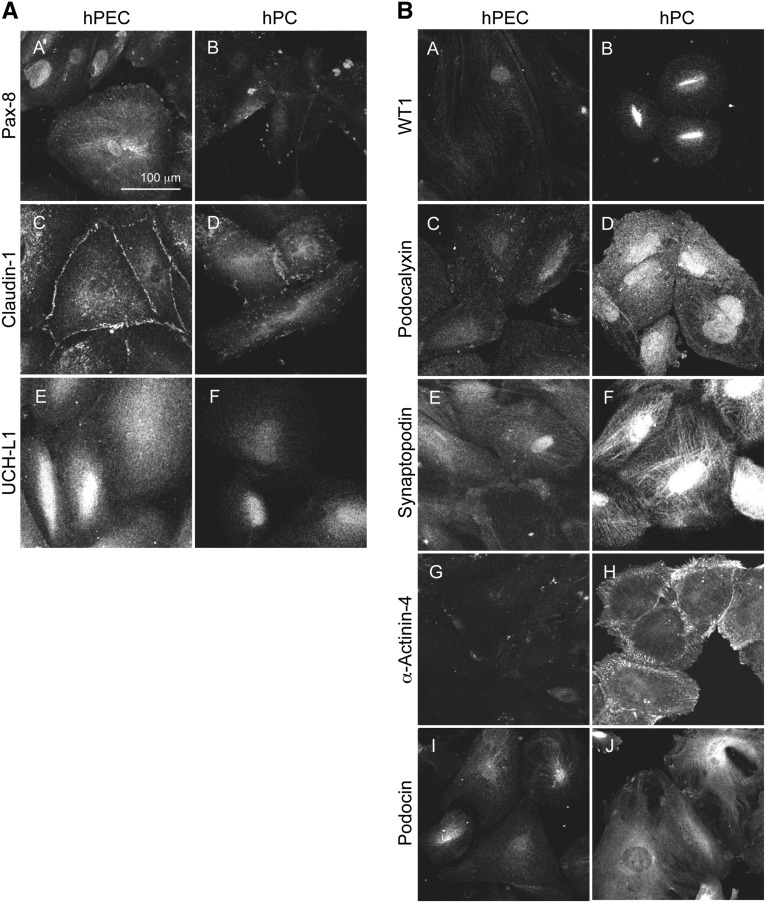
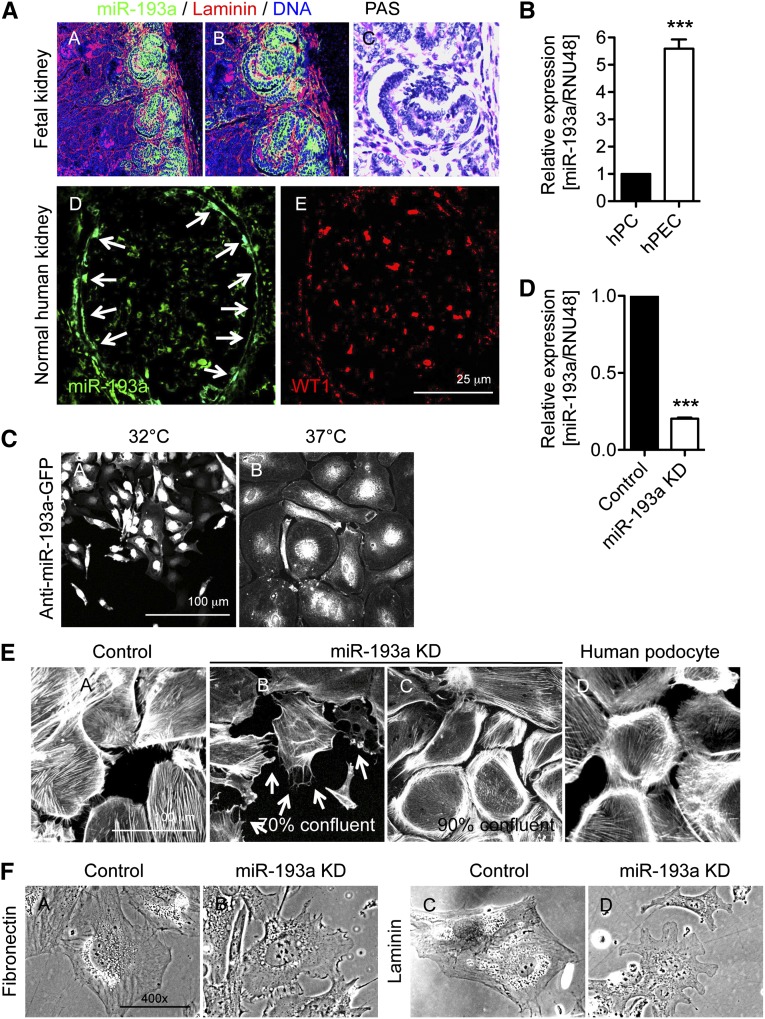
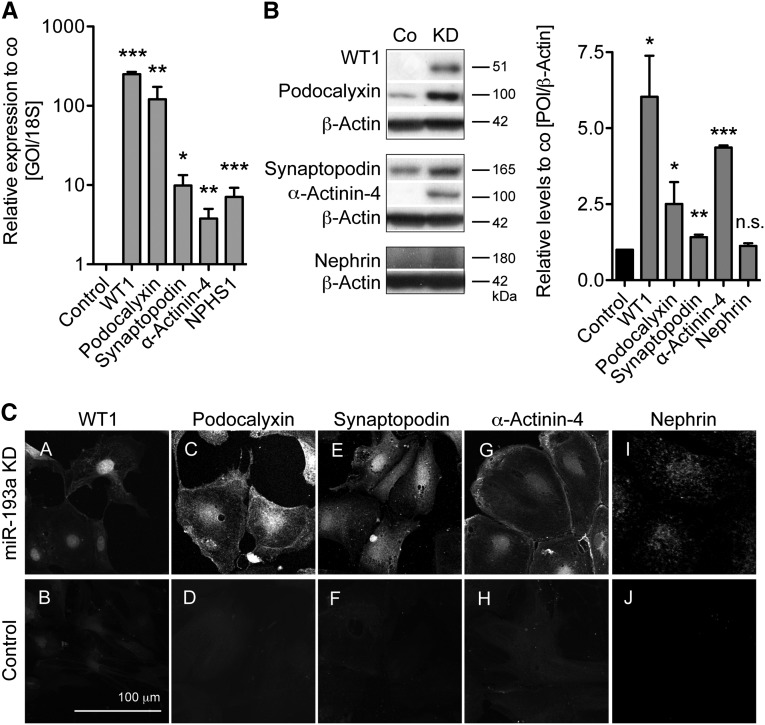
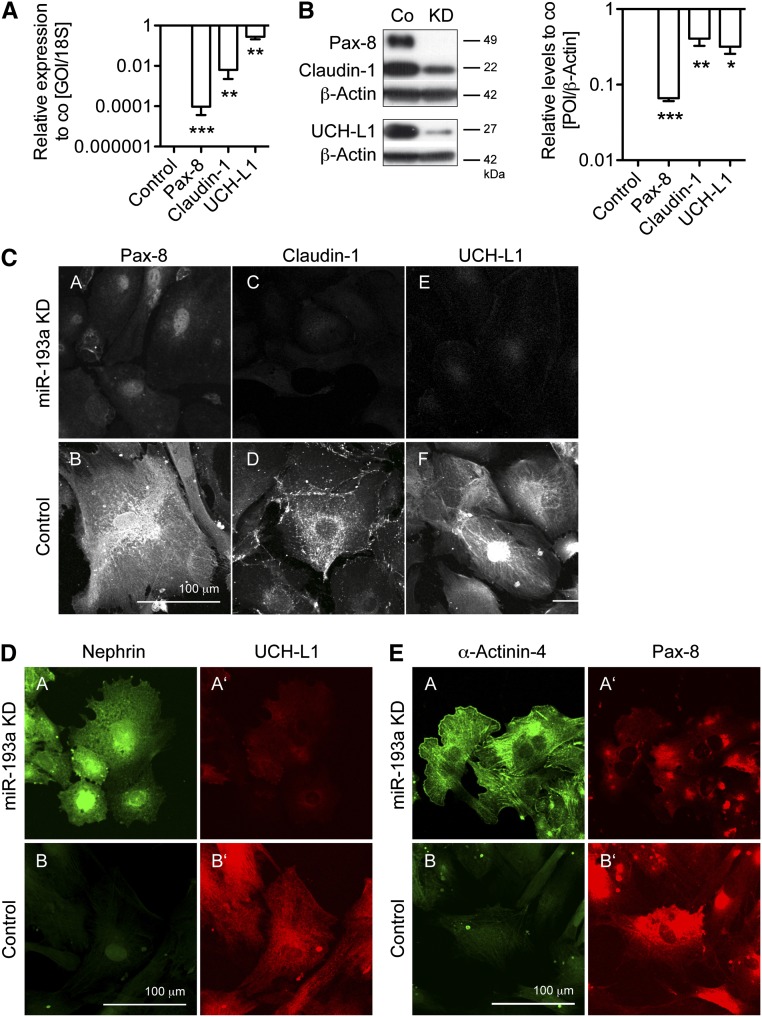
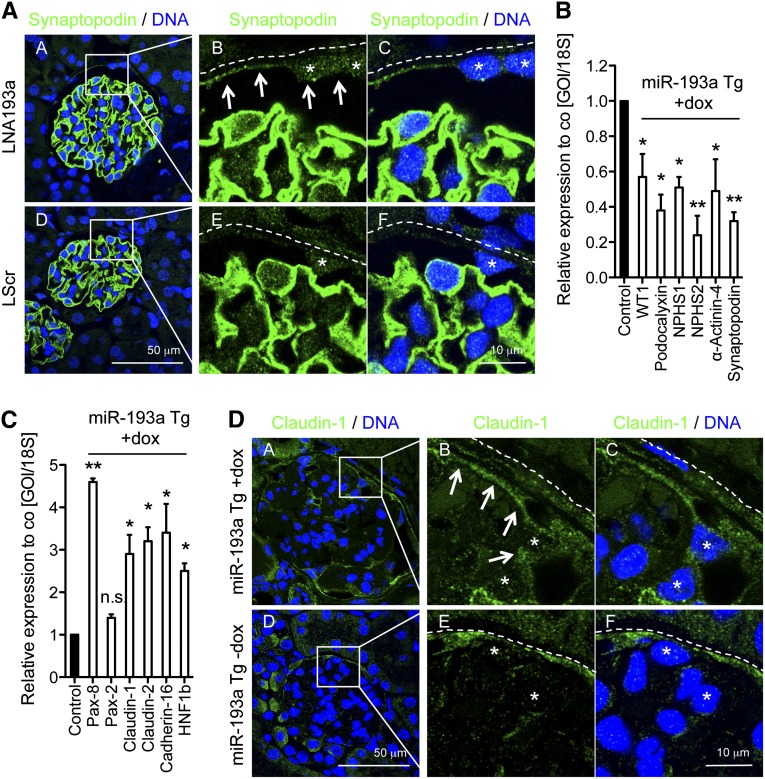
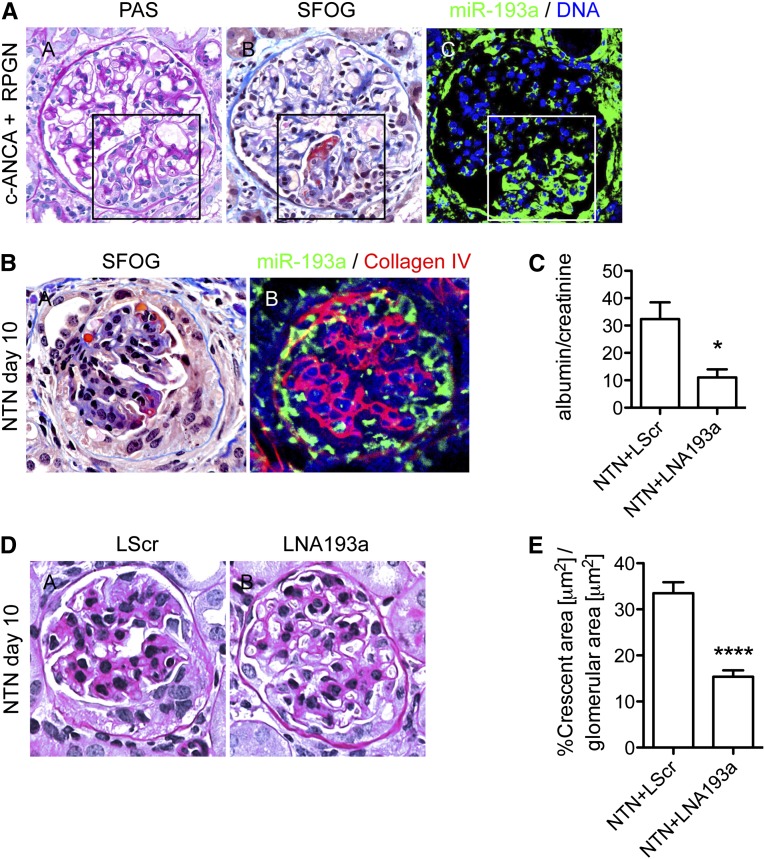
Parietal epithelial cells have been identified as potential progenitor cells in glomerular regeneration, but the molecular mechanisms underlying this process are not fully defined. Here, we established an immortalized polyclonal human parietal epithelial cell (hPEC) line from naive human Bowman's capsule cells isolated by mechanical microdissection. These hPECs expressed high levels of PEC-specific proteins and microRNA-193a (miR-193a), a suppressor of podocyte differentiation through downregulation of Wilms' tumor 1 in mice. We then investigated the function of miR-193a in the establishment of podocyte and PEC identity and determined whether inhibition of miR-193a influences the behavior of PECs in glomerular disease. After stable knockdown of miR-193a, hPECs adopted a podocyte-like morphology and marker expression, with decreased expression levels of PEC markers. In mice, inhibition of miR-193a by complementary locked nucleic acids resulted in an upregulation of the podocyte proteins synaptopodin and Wilms' tumor 1. Conversely, overexpression of miR-193a in vivo resulted in the upregulation of PEC markers and the loss of podocyte markers in isolated glomeruli. Inhibition of miR-193a in a mouse model of nephrotoxic nephritis resulted in reduced crescent formation and decreased proteinuria. Together, these results show the establishment of a human PEC line and suggest that miR-193a functions as a master switch, such that glomerular epithelial cells with high levels of miR-193a adopt a PEC phenotype and cells with low levels of miR-193a adopt a podocyte phenotype. miR-193a-mediated maintenance of PECs in an undifferentiated reactive state might be a prerequisite for PEC proliferation and migration in crescent formation.

Keywords: expression; podocyte; renal epithelial cell.


Figures

Scheme 1.
Scheme 1.
Isolation and immortalization scheme of human parietal cells.
Figure 1.
Figure 1.
Generation of a hPEC line. Human BCs were isolated as described in Concise Methods. (A) BCs or isolated tufts were cultured in EGM medium at 37°C. (A, A and A′) The first primary hPEC cell clusters appeared 9 days after isolation of BCs. (A, B and B′) Outgrowths from isolated glomeruli were also visible 9 days after isolation. Note (A′) the cobblestone appearance of primary culture hPECs compared with (B′) the multiform appearance of tuft outgrowths. (B) After immortalization of primary hPECs, immortalized hPECs were propagated at 32°C. For differentiation, cells were cultured at 37°C for 14 days. (B, A–C) F-Actin staining to visualize the actin cytoskeleton. Note the increase of cell size toward large polygonal cells on day 14. (D–F) Immunofluorescence against the proliferation marker PCNA. Note the decreased expression of PCNA in hPECs after 7 days of differentiation. (G–I) Immunofluorescence against the cyclin-dependent kinase inhibitor p27Kip1 to visualize increased proliferation arrest. Note the strong nuclear staining for p27Kip1 upon differentiation.
Figure 2.
Figure 2.
Immortalized hPECs highly expressed PEC-specific markers and express podocyte-specific markers at low levels. hPECs were differentiated for 14 days at 37°C, and the mRNA and protein expression levels of PEC-specific and podocyte-specific proteins were analyzed compared with an established immortalized human podocyte cell line (hPC). (A) Measurement of relative expression of PEC (white bars) and podocyte genes of interest (GOIs; gray bars) by qPCR in hPECs compared with hPC. Normalization occurred to 18S mRNA levels in each individual sample. n=3–4 per transcript. Values are expressed as mean±SEM. hPC=1. (B) Representative Western blots against (left panel) PEC- and (right panel) podocyte-specific proteins. (C) Densitometric quantification of WB experiments. β-Actin of the same membrane was used to control for equal loading. White bars represent the relative expression of PEC-specific proteins; gray bars represent the relative expression of podocyte-specific proteins to hPC (hPC=1). n=3–7. Values are expressed as mean±SEM. POI, protein of interest. *P<0.05; **P<0.01; ***P<0.001 to control (=1).
Figure 3.
Figure 3.
Expression pattern of PEC- and podocyte-specific markers in immortalized hPECs. hPECs were differentiated for 14 days at 37°C, and the expressions of (A) PEC- and (B) podocyte-specific proteins were analyzed by immunofluorescence compared with an established immortalized human podocyte cell line (hPC). The PEC markers Pax-8 (A, A and B), Claudin-1 (A, C and D), and UCH-L1 (A, E and F) were strongly expressed in hPECs and only expressed a little in hPCs. The podocyte markers WT1 (B, A and B), Podocalyxin (B, C and D), Synaptopodin (B, E and F), α-Actinin-4 (B, G and H), and Podocin (B, I and J) were only weakly expressed in hPECs compared with hPC.
Figure 4.
Figure 4.
hPECs express miR-193a, and KD of miR-193a results in hPEC transdifferentiation toward a podocyte phenotype. (A) Fluorescent in situ hybridization for miR-193a (green) in (A, A and B) a glomerulus of a fetal kidney (gestation week 27) and (A, D) a normal human kidney. (A, C) Corresponding light micrograph of a Periodic acid–Schiff (PAS) -stained section of the fetal kidney. (A, E) Immunofluorescence for WT1 (red) in a consecutive section of the same glomerulus exhibited in A, D. (B) hPECs were differentiated for 14 days at 37°C, and the relative expressions of miR-193a levels were measured by qPCR compared with differentiated human podocytes (hPCs; black bar; n=3). ***P<0.001 to hPC (=1). (C) Immunofluorescence image of GFP expression 24 hours after viral transduction of undifferentiated hPECs with anti–miR-193a–GFP plasmid (undifferentiated hPECs [C; A] and following differentiation [C; B]). Note the 90%–100% transduction efficiency before selection with puromycin. (D) miR-193a was stably knocked down in immortalized hPECs. qPCR analysis of relative miR-193a levels in differentiated hPECs with miR-193a KD compared with mock transfection (control; black bar). RNU48 was used as a home keeper, and values are expressed as mean±SEM (n=3). ***P<0.001 to control (=1). (E) Representative immunofluorescence against F-Actin (phalloidin) in (E, A) mock-transfected (control), miR-193 KD-differentiated hPECs (E, B) 70% confluent and (E, C) 90% confluent, and (E, D) differentiated human podocytes on day 14. Note the cortical actin ring in miR-193a KD hPECs and the processes (arrows). (F) Representative phase-contrast micrographs show arborization of hPECs with miR-193a KD when VRADD is added to the culture medium and the cells are grown on (F, B) fibronectin- or (F, D) laminin-coated dishes. Note the smooth cell border of control hPECs (mock-transfected hPECs) under the same culture conditions (F, A and C).
Figure 5.
Figure 5.
KD of miR-193a in hPECs results in increased transcript and protein levels of podocyte proteins. miR-193a was knocked down in hPECs differentiated for 14 days at 37°C, and the mRNA and protein expression levels of podocyte-specific proteins were analyzed compared with mock-transduced hPEC control cells. (A) Relative expression levels of podocyte-specific transcripts in hPECs with miR-193a KD compared with mock-transfected hPEC cells (control; n=3–6). 18S mRNA was used as a home keeper, and values are expressed as mean±SEM. GOI, gene of interest. *P<0.05; **P<0.01; ***P<0.001 to control (=1). (B, left panel) Western blotting for podocyte-specific proteins in mock-transduced hPECs or miR-193a KD hPECs after differentiation for 14 days. (B, Right panel) Densitometric quantification of n=3 WB experiments. β-Actin of the same membrane was used to control for equal loading. Values are expressed as mean±SEM. Co, control; POI, protein of interest. *P<0.05; **P<0.01; ***P<0.001 to control (=1). (C) Representative confocal micrographs of immunofluorescence staining for podocyte-specific proteins WT1 (C, A and B), Podocalyxin (C, C and D), Synaptopodin (C, E and F), α-Actinin-4 (C, G and H), Nephrin (C, I and J) in differentiated hPECs with miR-193a KD (C; A, C, E, G and I) or mock-GFP plasmid transduction (control) (C; B, D, F, H and J).
Figure 6.
Figure 6.
KD of miR-193a in hPECs results in decreased transcript and protein levels of PEC proteins. miR-193a was knocked down in hPECs differentiated for 14 days at 37°C, and the protein expression levels of PEC-specific proteins were analyzed compared with mock-transduced hPEC control cells. (A) Relative expression levels of PEC-specific transcripts in hPECs with miR-193a KD compared with mock-transfected hPEC (control; n=3–6). 18S mRNA was used as a home keeper, and values are expressed as mean±SEM. GOI, gene of interest. **P<0.01 to control (=1). (B, left panel) Western blotting for PEC-specific proteins in mock-transduced hPECs or miR-193a KD hPECs after differentiation for 14 days. (B, right panel) Densitometric quantification of n=3 WB experiments. β-Actin of the same membrane was used to control for equal loading. Values are expressed as mean±SEM. Co, control; POI, protein of interest. *P<0.05; **P<0.01; ***P<0.001 to control (=1). (C) Representative micrographs of immunofluorescence staining against PEC-specific proteins Pax-8 (C; A and B), Claudin-1 (C; C and D), UCH-L1 (C; E and F) in differentiated hPECs with miR-193a KD (C; A, C and E) or mock-GFP plasmid transduction (control) (C; B, D and F). (D and E) Representative micrographs of double immunofluorescence staining in hPECs differentiated on laminin-coated dishes and cultured with VRADD-supplemented medium show strong expression of the podocyte proteins Nephrin and α-Actinin-4 with a concomitant low expression of the PEC proteins UCH-L1 and Pax-8 in hPECs with (D, A, A′ and E, A, A′) miR-193a KD compared with (D, B and B′ and E, B and B′) control cells (mock-transfected hPECs) under the same culture conditions.
Figure 7.
Figure 7.
miR-193a regulates PEC and podocyte marker expression in vivo. (A) Mice were treated with intraperitoneal injections of LNA193a-5p to miR-193a or scrambled LNA as control, and the expression of Synaptopodin (green) in PECs was analyzed by immunohistochemistry of paraffin-embedded tissue. BC is highlighted with the dotted line (A; B; C, E and F), asterisks indicate PEC nuclei, and arrows point toward Synaptopodin-expressing PECs in the LNA193a-treated mouse (A; B). (B and C) miR-193a expression was induced in transgenic mice (miR-193a Tg) by administration of doxycycline (dox). Glomeruli were isolated and analyzed for the expression of (B) podocyte-specific mRNA or (C) PEC-specific mRNA expression compared with dox-treated wild-type littermate controls (co). Values are expressed as mean±SD. *P<0.05; **P<0.01 compared with wild type+dox. (D) Paraffin sections were analyzed for Claudin-1 green expression in podocytes after the induction of miR-193a overexpression in mice for 10 weeks. The dotted line indicates the BCs (D; B; C, E and F), asterisks indicate podocyte nuclei, and arrows point toward Claudin-1–expressing podocytes on overexpression of miR-193a (D; B).
Figure 8.
Figure 8.
miR-193a is expressed in human and murine crescents, and inhibition of miR-193a in murine NTN decreases crescent formation and proteinuria. (A) Representative micrographs of consecutive sections of a patient with c-ANCA–positive RPGN show miR-193a expression in PECs and crescents. (A, A) Periodic acid–Schiff staining (PAS). (A, B) Sour Fuchsin Orange G (SFOG) staining. (A, C) Fluorescent in situ hybridization (FISH) to miR-193a. The box in A, B and C highlights a crescent. (B, A) NTN was induced in male C57BL/6 mice. Mice were treated with intraperitoneal injections of LNA193a-5p-3p to miR-193a or scrambled LNA as control, and kidneys were analyzed 10 days after induction of NTN. (B, B) Representative micrographs of consecutive sections of a glomerulus of a mouse with NTN show miR-193a expression by FISH (green) in crescents and collagen type IV (red), and nuclei were visualized with DRAQ5 (blue). (C) Quantification of proteinuria by ELISA. Values were normalized to creatinine and are expressed as mean (milligrams/milligram) albumin/creatinine±SEM of n=5 mice per group. *P<0.05. (D) Representative micrographs of PAS staining in (D, A) LNA-scrambled (LScr) or (D, B) LNA193a-treated NTN mice. (E) Quantification of crescent size in 40 glomeruli per mouse in n=5 mice using axiovision computation. Crescent size in an individual glomerulus was normalized to glomerular area of the same glomerulus. Values are expressed as mean±SEM of n=5 mice per group. ****P<0.001.

Comment in

References

    1. Ohse T, Chang AM, Pippin JW, Jarad G, Hudkins KL, Alpers CE, Miner JH, Shankland SJ: A new function for parietal epithelial cells: A second glomerular barrier. Am J Physiol Renal Physiol 297: F1566–F1574, 2009 - PMC - PubMed
    1. Shankland SJ, Smeets B, Pippin JW, Moeller MJ: The emergence of the glomerular parietal epithelial cell. Nat Rev Nephrol 10: 158–173, 2014 - PubMed
    1. Discenza MT, He S, Lee TH, Chu LL, Bolon B, Goodyer P, Eccles M, Pelletier J: WT1 is a modifier of the Pax2 mutant phenotype: Cooperation and interaction between WT1 and Pax2. Oncogene 22: 8145–8155, 2003 - PubMed
    1. Kim MK, McGarry TJ, O Broin P, Flatow JM, Golden AA, Licht JD: An integrated genome screen identifies the Wnt signaling pathway as a major target of WT1. Proc Natl Acad Sci U S A 106: 11154–11159, 2009 - PMC - PubMed
    1. Grouls S, Iglesias DM, Wentzensen N, Moeller MJ, Bouchard M, Kemler R, Goodyer P, Niggli F, Gröne HJ, Kriz W, Koesters R: Lineage specification of parietal epithelial cells requires β-catenin/Wnt signaling. J Am Soc Nephrol 23: 63–72, 2012 - PMC - PubMed

Publication types

MeSH terms