. 2015 Jun;26(6):1363-77.
doi: 10.1681/ASN.2014040320. Epub 2014 Sep 30.

Specific macrophage subtypes influence the progression of rhabdomyolysis-induced kidney injury

Affiliations

Specific macrophage subtypes influence the progression of rhabdomyolysis-induced kidney injury

Julie Belliere et al. J Am Soc Nephrol. 2015 Jun.

Abstract

Rhabdomyolysis can be life threatening if complicated by AKI. Macrophage infiltration has been observed in rat kidneys after glycerol-induced rhabdomyolysis, but the role of macrophages in rhabdomyolysis-induced AKI remains unknown. Here, in a patient diagnosed with rhabdomyolysis, we detected substantial macrophage infiltration in the kidney. In a mouse model of rhabdomyolysis-induced AKI, diverse renal macrophage phenotypes were observed depending on the stage of the disease. Two days after rhabdomyolysis, F4/80(low)CD11b(high)Ly6b(high)CD206(low) kidney macrophages were dominant, whereas by day 8, F4/80(high)CD11b(+)Ly6b(low)CD206(high) cells became the most abundant. Single-cell gene expression analyses of FACS-sorted macrophages revealed that these subpopulations were heterogeneous and that individual cells simultaneously expressed both M1 and M2 markers. Liposomal clodronate-mediated macrophage depletion significantly reduced the early infiltration of F4/80(low)CD11b(high)Ly6b(high)CD206(low) macrophages. Furthermore, transcriptionally regulated targets potentially involved in disease progression, including fibronectin, collagen III, and chemoattractants that were identified via single-cell analysis, were verified as macrophage-dependent in situ. In vitro, myoglobin treatment induced proximal tubular cells to secrete chemoattractants and macrophages to express proinflammatory markers. At day 30, liposomal clodronate-mediated macrophage depletion reduced fibrosis and improved both kidney repair and mouse survival. Seven months after rhabdomyolysis, histologic lesions were still present but were substantially reduced with prior depletion of macrophages. These results suggest an important role for macrophages in rhabdomyolysis-induced AKI progression and advocate the utility of long-term follow-up for patients with this disease.

Keywords: Immunology and pathology; acute renal failure; chronic kidney disease; fibrosis; macrophages.; rhabdomyolysis.


Figures

Figure 1.
Figure 1.
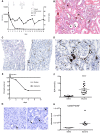
Rhabdomyolysis leads to macrophages recruitment in both human and mouse kidneys. (A) A 35-year-old patient was admitted for severe rhabdomyolysis. BUN and creatine kinase (CK) serum levels are reported (normal BUN, 2.5–7 mmol/L; CK, <170 IU/L). After 6 days the patient was anuric and a kidney biopsy was performed. (B) Hematoxylin-eosin staining of a kidney section (original magnification, ×200) revealed casts (*) and the loss of the proximal tubule brush border (arrows). (C) Anti-CD68 staining revealed macrophages in kidney sections from a control patient (left) and in the patient with rhabdomyolysis (right) (original magnification, ×100) or at ×200 magnification (D). Arrows indicate macrophages located within the tubular lumen (C and D). (E) C57BI/6 mice (males, 8–10 weeks old) were injected with saline (n=6) or 7.5 ml/kg 50% glycerol (n=20) in the thigh caudal muscles. Significant mortality was observed in the glycerol-treated group (P<0.05). (F) BUN was elevated 2 days after glycerol injection (n=18; ****P<0.0001). (G) Control (left image) and glycerol-treated mice (right image) kidney sections revealed an increase in F4/80 macrophages (arrows; original magnification, ×400). (H) Flow cytometry analysis of kidney CD45+F4/80+ cells based on absolute cell counts revealed an increase in the kidney macrophage number as well (n=6; **P<0.01).
Figure 2.
Figure 2.
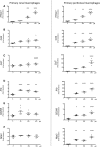
Myoglobin treatment of proximal tubular cells induces secretion of CCL-7 chemokine. Murine proximal tubular epithelial cells were treated or not with 50 μM myoglobin for 48 hours. (A) Relative mRNA expression levels of Hmox1 and macrophage-recruiting chemokines Ccl2 and Ccl7. (B) Culture supernatants were analyzed for the corresponding chemokine proteins (n=5–9; *P<0.05; **P<0.01). Lines display means±SEM. Black circles and squares display individual data in the vehicle and myoglobin groups, respectively.
Figure 3.
Figure 3.
The kidney macrophage subtype evolution mirrors kidney function. (A) The elevated BUN levels observed at day 2 (Figure 1F) decreased by day 8, indicating ongoing kidney repair (n=6–11). (B–D) Analysis of macrophages obtained from kidney cell suspensions. Three regions were discriminated according to the expression levels of CD11b and F4/80 as follows: F4/80-CD11b+ (R0), F4/80lowCD11bhigh (R1), and F4/80highCD11b+ (R2). CD11b corresponds to R0+R1+R2 sum. Macrophage distribution among the three regions was affected by glycerol injection at day 2 and day 8. (B) Representative dotplot gated on 30,000 live CD45+ cells. (C) R0, R1, R2, and total CD11b+ cell counts in kidney samples (n=3–5; **P<0.01 and ***P<0.001 compared with day 0; #P<0.05 and ####P<0.0001 compared with day 2). (D) Distribution of CD11b+ cells in the three regions (n=3–5). Macrophage subpopulations were characterized by expression of surface markers using flow cytometry. Mean fluorescence intensity (MFI) is reported on the yaxis for the following markers: (E) CD206 (M2 marker) and (F) CD36 (M2 marker). (n=3–9; *A star above a line displays P<0.05; #displays significant difference between R2 at day 2 or day 8 compared with R2 at day 0 [p<0.05]; $displays significant difference between R1 at day 8 compared with R1 at day 2 [p<0.05]. Lines display means±SEM for individual data).
Figure 4.
Figure 4.
Myoglobin polarizes macrophages simultaneously toward M1 and M2 phenotypes in vitro. Primary renal macrophages (left; R2 and R1 fractions sorted from control kidneys) and peritoneal macrophages (right) were treated with increasing doses of myoglobin for 4 hours. Relative mRNA expression (fold induction) is depicted for (A) Hmox1, (B and C) chemoattractants Ccl2 and Ccl7, (D) M1 marker (Il1b), (E) M2 marker (CD206), and (F) inflammasome transcription factor Nlrp3. n=pool of 11 mice for renal isolates, n=3–4 individual mice for peritoneal isolates. (*P<0.05; **P<0.01; ***P<0.001; ****P<0.0001.)
Figure 5.
Figure 5.
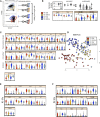
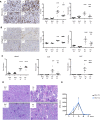
Rhabdomyolysis modifies individual macrophages transcriptional activity. (A) Study design. Kidney macrophages were FACS-sorted to obtain R1 (F4/80lowCD11bhigh) and R2 (F4/80highCD11b+) macrophages from mice, 2 days after intramuscular injection of saline or glycerol (Gly). Cells were loaded onto a chip to obtain cDNA from individual, viable single cells. Ninety-six mRNA expression profiles were then monitored by quantitative PCR. Data were converted into Log2Ex, which gives a higher value for cells with better detection, and plotted as violin plots. (B) Controls. The housekeeper genes Gapdh and Ppia exhibited unimodal expression (bottom left). F4/80 and CD11b mRNAs expression were consistent with proteins used in sorting (bottom right). (C) Glycerol effect. Differential gene expression between the glycerol and saline conditions. H2-Aa (CMH II) is the only monitored gene with a decreased expression in glycerol-treated mice compared with saline-treated mice (*P<0.05). (D–F) R1-R2 comparison. (D) MDS/PCoA plot (multidimensional scaled principal coordinate analysis), which permits a global view of differences in gene expression, shows that R1-Gly and R2-Gly exhibit distinct signatures. (E) The R1-Gly–specific profile included nine genes. Of note, Fn1 (fibronectin) and Chi3l3 (also known as Ym-1) expression was restricted to R1-Gly. (F) The R2-Gly specific profile included 11 genes. Of note, CD36, MMP-13, and Mrc1 (CD206) are M2 markers. (P<0.05 for R1-Gly versus R2-Gly comparison in E and F.)
Figure 6.
Figure 6.
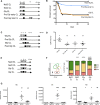
CL-mediated macrophage depletion protects against glycerol-induced AKI and related mortality. (A) Study design to determine whether early or late CL treatment modified survival (n=3–20). (B) Early CL treatment improved animal survival (P<0.05). Detailed mice numbers are available in Supplemental Figure 7B. (C) Study design to determine whether CL treatment before or directly after rhabdomyolysis modified the severity of AKI (n=4–6). (D) These three different protocols of CL treatment improved kidney function at day 8 in a similar manner (**P<0.01). (E) Study design to determine whether CL treatment modified macrophages subsets. (F) CD11b+ distribution in the three regions. n=3–6. (G) R0, R1, and R2 kidney macrophages counts are depicted. CL treatment predominantly decreased the R1 subset. (Versus NaCl EL: *P<0.05; ***P<0.001; ****P<0.0001. Versus Gly EL: ##P<0.01; ####P<0.0001.) White triangles, EL; white squares, NaCl; shaded triangles, CL; black squares, glycerol.
Figure 7.
Figure 7.
CL-mediated macrophage depletion attenuates kidney lesions 2 days after glycerol injection. Mice received EL or lCL in the saline (NaCl) or the glycerol (Gly) condition according to the protocol shown in Figure 6E. (A and B) CL reduced glycerol-induced fibronectin (Original magnification, ×400 in A) and collagen III (Original magnification, ×200 in B) accumulation at the protein level (left panel; n=3–9) and at the mRNA level in the whole kidney (right panel; n=5–6). (C) Hmox1 was upregulated by glycerol treatment and not modified by CL. CL reduced glycerol-induced Ccl2 and Ccl7 mRNA expression (n=5–6). (Versus NaCl EL: ***P<0.001 and ****P<0.0001. Versus glycerol EL: ##P<0.01; ###P<0.001; ####P<0.0001.) (D) CL reduced glycerol-induced lesions on periodic acid-Schiff staining (Original magnification, ×200 in representative examples). (E) CL did not affect rhabdomyolysis intensity (n=4–8).
Figure 8.
Figure 8.
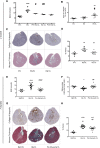
CL-mediated macrophage depletion attenuates kidney fibrosis. (A–D) One month after rhabdomyolysis. CTL, age-matched control group; Gly, glycerol-treated group; Gly CL, CL-treated mice according to the pre, post, and glycerol CL protocol depicted in Figure 6C. (A) BUN levels (n=2–6). (B) CD206+ expression was significantly increased in the glycerol CL condition among CD11b+ cells (R0, R1, and R2) (n=5–8). (C) Collagen III and Masson trichrome staining (representative examples are shown). (D) Collagen III deposit quantification (n=5–7). (Versus control: **P<0.01 and ****P<0.0001. Versus Gly: #P<0.05 and ##P<0.01.) (E–H) Seven months after rhabdomyolysis. NaCl EL, glycerol EL, and pre-glycerol early CL refer to mice treated according to the protocol depicted in Figure 6A. (E) BUN levels (n=6–14). (F) Kidney mass indicated global atrophy after glycerol injection. (n=6–14) (G) Collagen III and Masson trichrome staining (representative examples are shown). (H) Collagen III deposits were still significantly increased in the glycerol condition, which was partially prevented by CL (n=6–14). (Versus NaCl EL: *P<0.05 and ****P<0.0001. Versus glycerol: #P<0.05, ##P<0.01, ####P<0.0001.)
Figure 9.
Figure 9.
Proposed early mechanisms involved in rhabdomyolysis-induced kidney injury. (1) In response to myoglobin, tubular cells secrete macrophage chemoattractants (Ccl2, Ccl7). (2) In response to these chemoattractants blood monocytes migrate to the renal interstitium. (3) In addition to its effect on tubular cells, myoglobin polarizes these macrophages toward a proinflammatory phenotype. (4) CD11bhighF4/80lowLy6-Bhigh subtype macrophages enhance renal injury by secreting extracellular matrix compounds (fibronectin, collagen III), proinflammatory cytokines (Il1b, Il12p40) and by increasing recruitment of newly generated macrophages (secretion of Ccl2 and Ccl7).

References

    1. Bosch X, Poch E, Grau JM: Rhabdomyolysis and acute kidney injury. N Engl J Med 361: 62–72, 2009 - PubMed
    1. Zarjou A, Bolisetty S, Joseph R, Traylor A, Apostolov EO, Arosio P, Balla J, Verlander J, Darshan D, Kuhn LC, Agarwal A: Proximal tubule H-ferritin mediates iron trafficking in acute kidney injury. J Clin Invest 123: 4423–4434, 2013 - PMC - PubMed
    1. Zager RA: Studies of mechanisms and protective maneuvers in myoglobinuric acute renal injury. Lab Invest 60: 619–629, 1989 - PubMed
    1. Zager RA, Gamelin LM: Pathogenetic mechanisms in experimental hemoglobinuric acute renal failure. Am J Physiol 256: F446–F455, 1989 - PubMed
    1. Fähling M, Mathia S, Paliege A, Koesters R, Mrowka R, Peters H, Persson PB, Neumayer HH, Bachmann S, Rosenberger C: Tubular von Hippel-Lindau knockout protects against rhabdomyolysis-induced AKI. J Am Soc Nephrol 24: 1806–1819, 2013 - PMC - PubMed

Publication types

MeSH terms