

Detection of renal allograft rejection using blood oxygen level-dependent and diffusion weighted magnetic resonance imaging: a retrospective study
- PMID: 25270976
- PMCID: PMC4192395
- DOI: 10.1186/1471-2369-15-158
Detection of renal allograft rejection using blood oxygen level-dependent and diffusion weighted magnetic resonance imaging: a retrospective study
Abstract
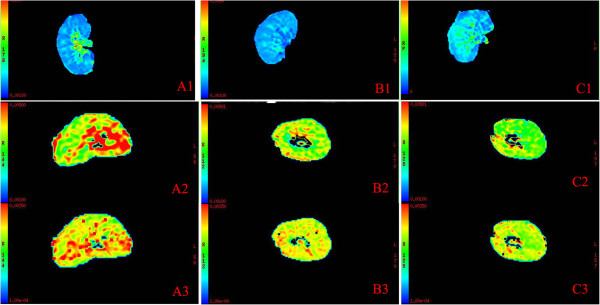
Background: Acute rejection (AR) and acute tubular necrosis (ATN) are main causes of early renal allograft dysfunction. Blood oxygen level-dependent magnetic resonance imaging (BOLD MRI) and Diffusion weighted (DW) MRI can provide valuable information about changes of oxygen bioavailability and water diffusion by measuring R2* or apparent diffusion coefficient (ADC) respectively. We aimed to determine the value of BOLD MRI and DW MRI in detecting causes for early allograft dysfunction in renal allograft recipients.
Methods: Fifty patients received renal allografts from deceased donors were analyzed, including 35 patients with normal renal function (control group), 10 AR patients and 5 ATN patients. Cortical R2* (CR2*) and medullary R2* (MR2*) were measured by BOLD MRI. Ten diffusion gradient b values (0, 5, 10, 20, 50, 100, 200, 400, 800, 1200s/mm2) were used in DW MRI. ADC values were measured in renal cortex (CADC) and medulla (MADC). CADCl and MADCl were measured under low b values (b ≤ 200 s/mm2), while CADCh and MADCh were measured under high b values (b > 200 s/mm2).
Results: MR2* was significantly lower in AR group (18.2 ± 1.5/s) than control group (23.8 ± 5.0/s, p = 0.001) and ATN group (25.8 ± 5.0/s, p = 0.004). There was a tendency of lower levels on CADCl, MADCl, CADCh or MADCh in AR group than in control group. There were no differences on ADC values between AR group and ATN group.
Conclusions: BOLD MRI was a valuable method in detection of renal allografts with acute rejection.
Figures
References
-
- Djamali A, Sadowski EA, Samaniego-Picota M, Fain SB, Muehrer RJ, Alford SK, Grist TM, Becker BN. Noninvasive assessment of early kidney allograft dysfunction by blood oxygen level-dependent magnetic resonance imaging. Transplantation. 2006;82:621–628. doi: 10.1097/01.tp.0000234815.23630.4a. - DOI - PubMed
Pre-publication history
-
- The pre-publication history for this paper can be accessed here:http://www.biomedcentral.com/1471-2369/15/158/prepub
Publication types
MeSH terms
Substances
LinkOut - more resources
Full Text Sources
Other Literature Sources
Medical
Research Materials
