. 2014 Dec;137(Pt 12):3300-18.
doi: 10.1093/brain/awu278. Epub 2014 Sep 29.

Defective macroautophagic turnover of brain lipids in the TgCRND8 Alzheimer mouse model: prevention by correcting lysosomal proteolytic deficits

Affiliations

Defective macroautophagic turnover of brain lipids in the TgCRND8 Alzheimer mouse model: prevention by correcting lysosomal proteolytic deficits

Dun-Sheng Yang et al. Brain. 2014 Dec.

Abstract

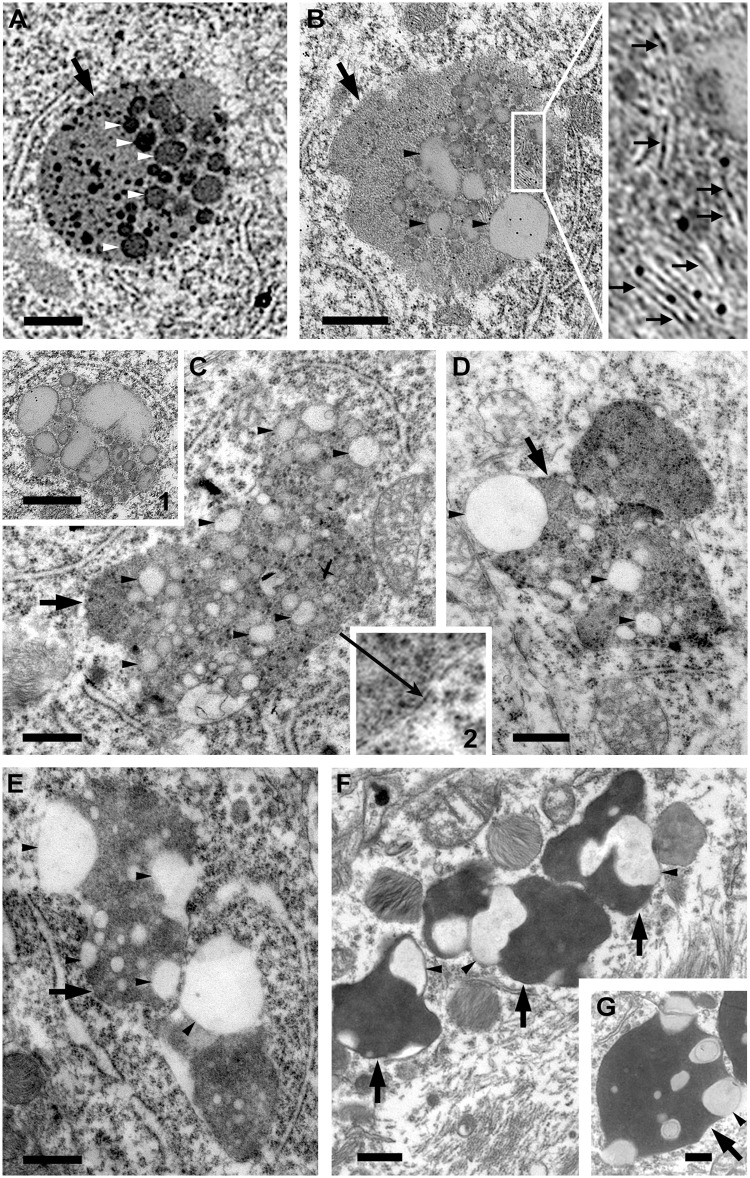
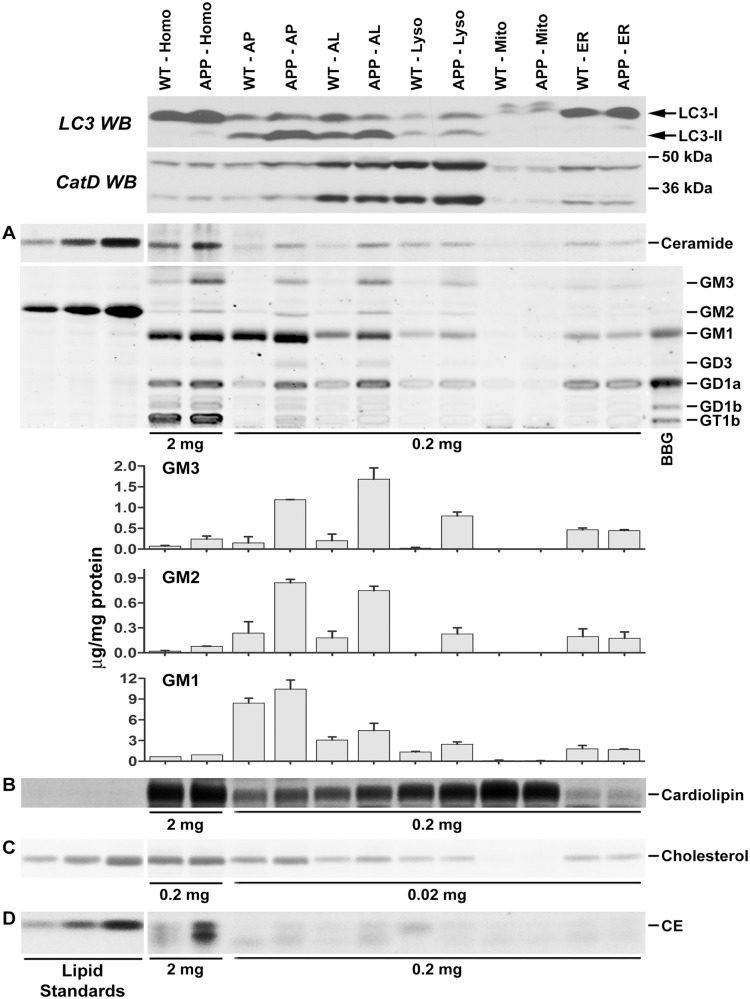
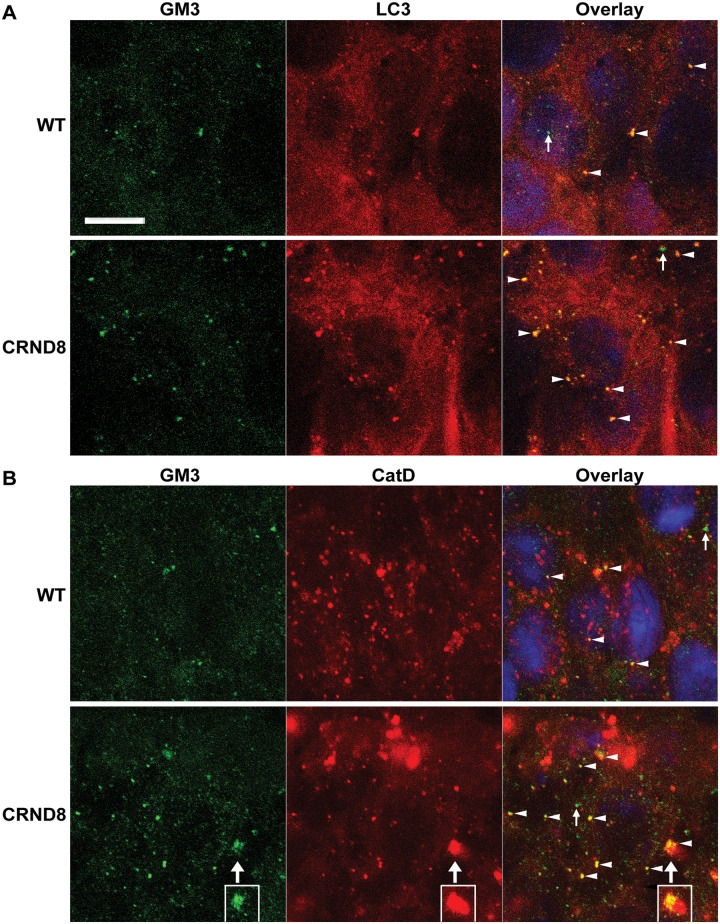
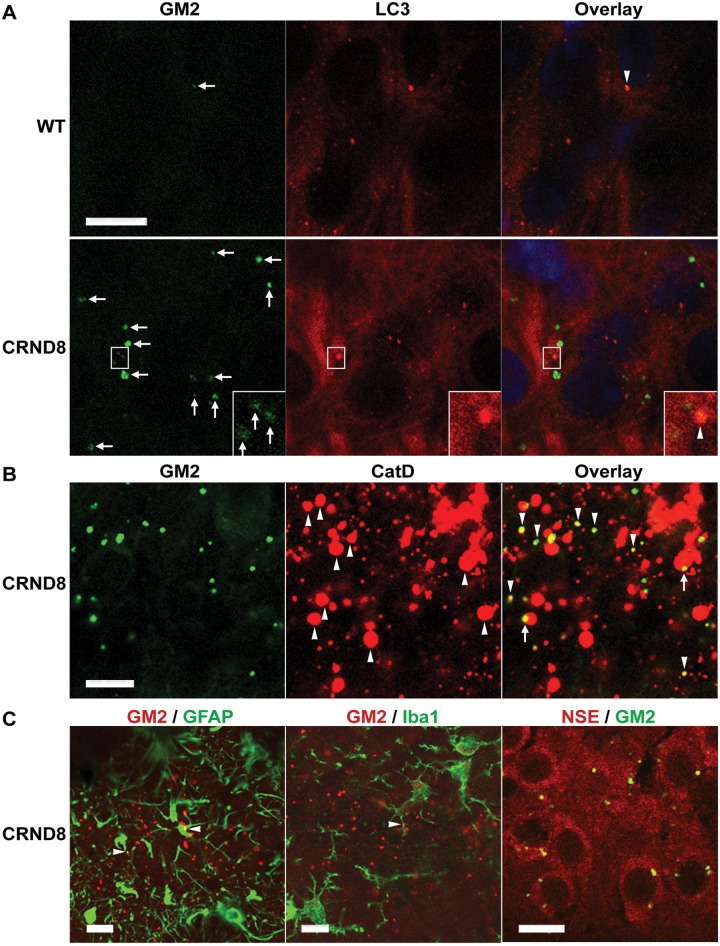
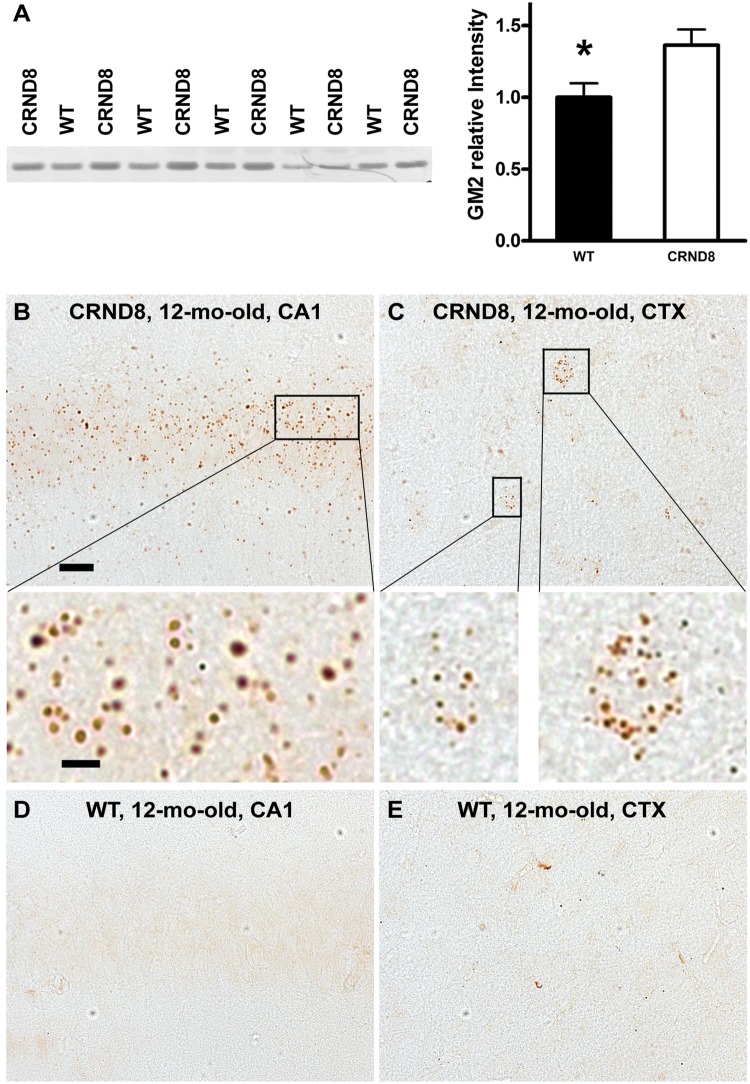
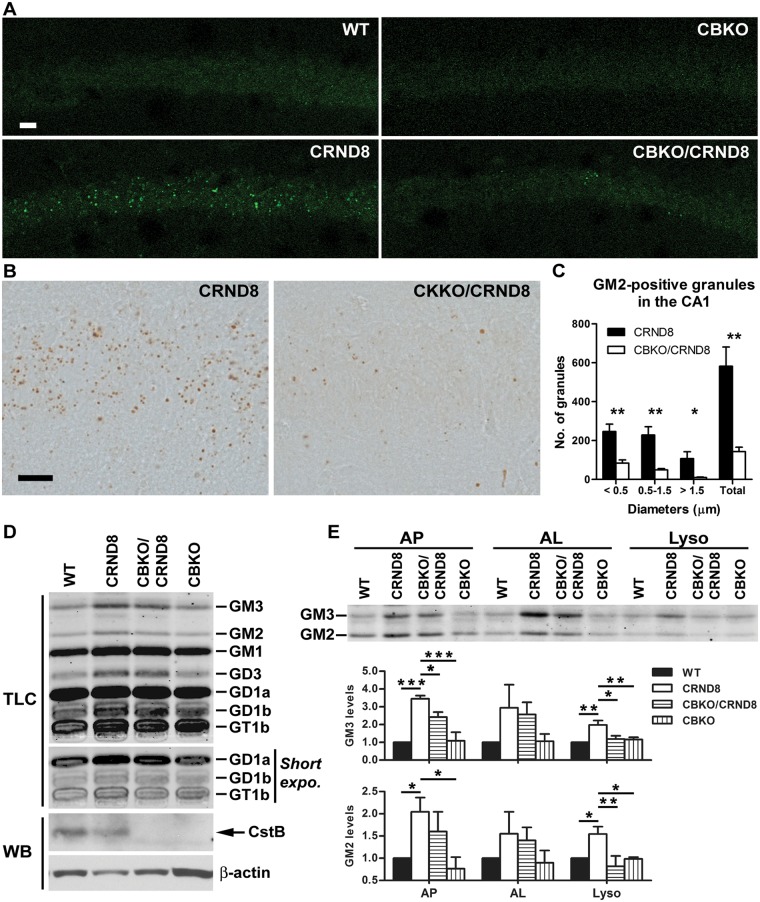
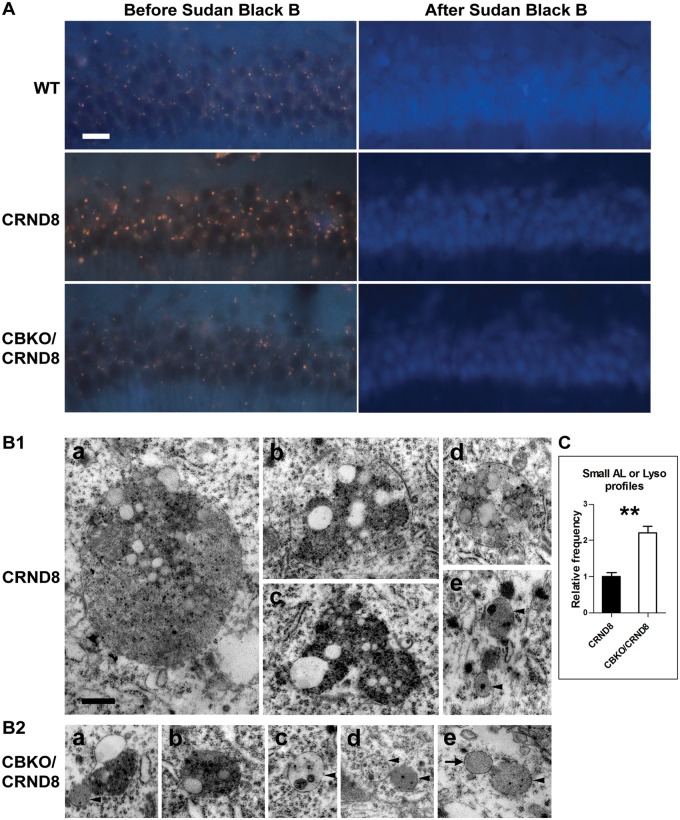
Autophagy, the major lysosomal pathway for the turnover of intracellular organelles is markedly impaired in neurons in Alzheimer's disease and Alzheimer mouse models. We have previously reported that severe lysosomal and amyloid neuropathology and associated cognitive deficits in the TgCRND8 Alzheimer mouse model can be ameliorated by restoring lysosomal proteolytic capacity and autophagy flux via genetic deletion of the lysosomal protease inhibitor, cystatin B. Here we present evidence that macroautophagy is a significant pathway for lipid turnover, which is defective in TgCRND8 brain where lipids accumulate as membranous structures and lipid droplets within giant neuronal autolysosomes. Levels of multiple lipid species including several sphingolipids (ceramide, ganglioside GM3, GM2, GM1, GD3 and GD1a), cardiolipin, cholesterol and cholesteryl esters are elevated in autophagic vacuole fractions and lysosomes isolated from TgCRND8 brain. Lipids are localized in autophagosomes and autolysosomes by double immunofluorescence analyses in wild-type mice and colocalization is increased in TgCRND8 mice where abnormally abundant GM2 ganglioside-positive granules are detected in neuronal lysosomes. Cystatin B deletion in TgCRND8 significantly reduces the number of GM2-positive granules and lowers the levels of GM2 and GM3 in lysosomes, decreases lipofuscin-related autofluorescence, and eliminates giant lipid-containing autolysosomes while increasing numbers of normal-sized autolysosomes/lysosomes with reduced content of undigested components. These findings have identified macroautophagy as a previously unappreciated route for delivering membrane lipids to lysosomes for turnover, a function that has so far been considered to be mediated exclusively through the endocytic pathway, and revealed that autophagic-lysosomal dysfunction in TgCRND8 brain impedes lysosomal turnover of lipids as well as proteins. The amelioration of lipid accumulation in TgCRND8 by removing cystatin B inhibition on lysosomal proteases suggests that enhancing lysosomal proteolysis improves the overall environment of the lysosome and its clearance functions, which may be possibly relevant to a broader range of lysosomal disorders beyond Alzheimer's disease.

Keywords: Alzheimer’s disease; TgCRND8; autophagy; lipids; lysosome.


Figures

Figure
1
Figure 1
Accumulation of membrane structures and lipid inclusions within autolysosomes in the brain of TgCRND8 suggesting impaired lipid degradation. (A–E) Electron microphotographs taken from the CA1 area of 6-month-old TgCRND8 showing a variety of giant autolysosomes (large arrows), which contain numerous stacked membranes (small arrows), round/oval vesicular structures (white arrowheads) and light-density lipid inclusions compatible with lipid droplets (black arrowheads). Some of the giant autolysosomes seem to be formed from fusion of two or more autolysosomes (C–E). The inset in B is the higher magnification view of the boxed area. Inset 1 in C shows a loosely packed cluster of lipid droplets found in the cytosol without limiting membrane, and Inset 2 in C demonstrates the limiting membrane (long arrow) of the giant autolysosome. (F and G) Images taken from biopsy samples from an Alzheimer’s disease brain, showing lipid inclusions (black arrowheads) in enlarged autolysosomes (lipofuscin granules) (large arrows). Scale bars = 500 nm.
Figure
2
Figure 2
Increased levels of lipids in autophagic-lysosomal fractions isolated from the brain of TgCRND8 detected by thin layer chromatography. Brain homogenates or subcellular fractions were prepared from 12-month-old TgCRND8 and wild-type mice (WT) and examined for relative enrichment of autophagic-lysosomal protein markers by western blotting (WB) with an anti-MAP1LC3A (LC3) or -CTSD antibody (CatD) (top two panels). Lipids, after extraction, were separated on thin layer chromatography plates for the detection of sphingolipids (A), cardiolipin (B), unesterified cholesterol (C) and cholesteryl esters (D). To achieve equal loading, we used equal total protein amounts (indicated at the bottom of thin layer chromatography panels), which were used for lipid extraction, to guide loading of samples. Note that 10-fold higher amounts of samples were used for ganglioside analyses of homogenates compared to those of other fractions. (A, bar graphs): the amounts of GM3, GM2 and GM1 obtained from two separate experiments (three to five pooled mouse brains per genotype per experiment) were calculated as μg/mg protein as described in the ‘Materials and methods’ section using various amounts (0.31, 0.63, 1.25, 2.5. 5.0 μg) of GM2 standard (In A, middle, only 1.25, 2.5. 5.0 μg of standard GM2 gangliosides are shown). Values are the mean ± SEM. (The quantitative data for ceramide, cardiolipin, unesterified cholesterol and cholesteryl esters are presented in Supplementary Fig. 2). Homo = homogenate; AP = autophagosome enriched fraction; AL = autolysosome enriched fraction; Lyso = lysosome; Mito = mitochondria; ER = endoplasmic reticulum-enriched; BBG = bovine brain gangliosides; CE = cholesteryl esters. The arrow indicates an unidentified lipid species. ‘APP’ = TgCRND8.
Figure
3
Figure 3
Co-localization of GM3 with autophagic-lysosomal markers in the hippocampus of wild-type and TgCRND8 brain. Vibratome brain sections from 12-month-old wild-type (WT) and TgCRND8 (n = 3/genotype) were double-stained for GM3 and an autophagosome marker, MAP1LC3A (LC3) (A) or an autolysosome/lysosome marker, CTSD (CatD) (B), followed by staining with Sudan Black B to block autofluorescence. Confocal digital single-plane (1 µm) images from z-stacks taken from the hippocampal pyramidal cell layer are shown. Examples showing co-localization of GM3 signal with MAP1LC3A or CTSD are indicated by arrowheads in the merged images. Small arrows depict profiles which are predominantly in green colour indicating that the green signals for GM3 are not due to carry-over from the red channel. The boxed areas in B are from a consecutive single-plane showing the same giant autolysosome (large arrows) with massive GM3 signal accumulation. Scale bars = 10 µm. ‘CRND8’ = TgCRND8.
Figure 4
Figure 4
Co-localization of GM2 with autophagic-lysosomal or neuronal markers in the hippocampus of wild-type and TgCRND8 brain. (A–C) Vibratome brain sections from 12-month-old wild-type (WT) and TgCRND8 (n = 3/genotype) were double-stained for GM2 and other markers as indicated, followed by staining with Sudan Black B to block autofluorescence, and images taken from the hippocampal pyramidal cell layer are shown. (A) Double labelling of GM2 with the autophagosome marker MAP1LC3A (LC3). Examples showing co-localization of GM2 signal with MAP1LC3A are indicated by arrowheads in the merged images. Small arrows depict GM2-positive profiles with variable staining intensity. The insets are the enlarged views of the boxed areas showing that the weakly stained GM2 profile(s) can be observed within a strong MAP1LC3A-positive profile. (B) Double labelling of GM2 and CTSD (CatD). Upward arrowheads indicate numerous abnormal giant autolysosomes in TgCRND8 [Note: it seems that there is also a small CTSD-positive amyloid plaque(s) within the image, see top right corner]. The merged image depicts that the majority of GM2-signal is associated with CTSD-positive lysosomes, either having a high degree of co-localization with the CTSD signal (downward arrowheads) or occupying a portion of those CTSD-stained giant autolysosomes (arrows). (C) Double labelling of GM2 with a marker for either astrocytes (GFAP), microglia (IBA1) or neurons (neuron-specific enolase, NSE). Little GM2 signal is co-localized with GFAP or IBA1 staining, except the minimal areas indicated by arrowheads. GM2/NSE double labelling reveals overlapping of GM2 signal on NSE-stained neuronal cytoplasm. Scale bars = 10 µm. ‘CRND8’ = TgCRND8.
Figure 5
Figure 5
Accumulation of GM2 ganglioside in TgCRND8 brain revealed by immunodetection. (A) Thin layer chromatography immunostaining reveals increased GM2 levels in the brain of TgCRND8. Total lipid extracts were prepared from brain homogenates of 12-month-old TgCRND8 and wild-type (WT) mice (n = 5–6 mice per genotype) and loaded onto C18 Sep-Pak cartridges. The eluted fractions containing gangliosides were separated on thin layer chromatography plates and immunostained with a thin layer chromatography overlay method using an anti-GM2 antibody to reveal GM2 signal (left) which was scanned and the band relative densities were analysed (right). Values are the mean ± SEM for each group. Significant differences were analysed by two-tailed Student’s t-test. *P < 0.05. (B–E) Immunohistochemistry reveals abundance of GM2-positive granules in the brains of TgCRND8. Vibratome sections from TgCRND8 and age-matched wild-type mice (n = 4–6 mice per age per genotype) were immunostained with an anti-GM2 antibody. (B and C) Representative microphotograph images from the hippocampal CA1 sector (B) and the neocortex (CTX) (C) of a 12-month-old TgCRND8 mouse depict abundant GM2-positive granules in the CA1 pyramidal cell layer and in some cortical neurons. Magnified images of the boxed areas are shown below the low-power images. (D and E) Images of a brain section from a wild-type littermate exhibit little or no GM2-immunostaining in the CA1 sector (D) and the CTX (E). Scale bar in B = 20 µm for (B–E); bar for the enlarged images of (B and C) = 5 µm. ‘CRND8’ = TgCRND8.
Figure
6
Figure 6
Effect of cystatin B deletion in TgCRND8 on the levels of gangliosides. (A–C) Reduction in the numbers of GM2-positive granules in the CA1 area of CBKO/TgCRND8. Vibratome brain sections from a group of 6-month-old wild-type (WT), CBKO, TgCRND8 and CBKO/TgCRND8 mice (strains: 129S6 × 129X1 for the four genotypes) were processed with the anti-GM2 antibody and visualized by either immunofluorescence (A) or DAB (B). Scale bars = 20 µm. (C) Sections visualized by DAB were quantified for the numbers of GM2-positive granules (grouped by diameters) in the CA1 area of either TgCRND8 or CBKO/TgCRND8. Values are the mean ± SEM for each group (n = 5 TgCRND8 or 6 CBKO/TgCRND8). Significant differences were analysed by two-tailed Student’s t-test. *P < 0.05, **P < 0.01. (D) Lipid extracts were prepared from the brain lysosome fraction from a group of 6-month-old wild-type, CBKO, TgCRND8 and CBKO/TgCRND8 mice and separated on a thin layer chromatography plate for the analysis of gangliosides. To achieve equal loading, we used equal total protein amounts [indicated at the bottom of thin layer chromatography (TLC) panels], which were used for lipid extraction, to guide loading of samples. Western blotting (WB) of CSTB in the lysosome fraction using a homemade anti-mouse CstB polyclonal antibody (Yang et al., 2011) depicts the presence of CSTB bands in samples from wild-type and TgCRND8 but the absence in samples from CBKO and CBKO/TgCRND8, confirming the genotypes of the mice used. Actin was used as a loading control. (E) The thin layer chromatography panel represents GM3 and GM2 profiles from lipid extracts of autophagosome, autolysosome and lysosome fractions, while the bar graphs depict the quantitative results from three separate experiments (n = 3; 4–6 pooled mouse brains per genotype per experiment). Values are mean ± SEM showing relative levels of GM3 or GM2 (normalized against the level of wild-type) in each fraction. Mean differences between genotypes were analysed by one way ANOVA followed by post hoc Bonferroni’s multiple comparison tests (‘selected pairs of columns’). *P < 0.05, **P < 0.01, ***P < 0.001. ‘CRND8’ = TgCRND8.
Figure 7
Figure 7
Effect of cystatin B deletion in TgCRND8 on lipid accumulation. (A) Untreated vibratome brain sections from 6-month-old mice were examined under ultraviolet light and autofluorescence, presented as yellow-brown lipofuscin granules, in the CA1 area was captured (left). The sections were then incubated with Sudan Black B to block autofluorescence, and images from the same area were collected (right). Scale bars = 20 µm. (B) Comparison of electron microscopy images collected from the CA1 sector of TgCRND8 [B(1)] or CBKO/TgCRND8 [B(2)]. The bar graph shows the quantification of relative abundance of small autolysosomes/lysosomes (AL/Lyso), defined as being <1 µm in diameter, round or oval in shape, single membrane-bound and containing only a small amount (arrowheads) or none (arrow) of undigested components [i.e. those shown in B(1e) and B(2c–e)], in TgCRND8 (n = 4) or CBKO/TgCRND8 (n = 4). Significant differences were analysed by two-tailed Student’s t-test. **P < 0.01. Scale bar in B(1a) = 500 nm for all panels. ‘CRND8’ = TgCRND8.

References

    1. Andreyev AY, Fahy E, Guan Z, Kelly S, Li X, McDonald JG, et al. Subcellular organelle lipidomics in TLR-4-activated macrophages. J Lipid Res. 2010;51:2785–97. - PMC - PubMed
    1. Ariga T, Wakade C, Yu RK. The pathological roles of ganglioside metabolism in Alzheimer's disease: effects of gangliosides on neurogenesis. Int J Alzheimers Dis. 2011;2011:193618. - PMC - PubMed
    1. Ariga T, Yanagisawa M, Wakade C, Ando S, Buccafusco JJ, McDonald MP, et al. Ganglioside metabolism in a transgenic mouse model of Alzheimer's disease: expression of Chol-1alpha antigens in the brain. ASN Neuro. 2010;2:e00044. - PMC - PubMed
    1. Axe EL, Walker SA, Manifava M, Chandra P, Roderick HL, Habermann A, et al. Autophagosome formation from membrane compartments enriched in phosphatidylinositol 3-phosphate and dynamically connected to the endoplasmic reticulum. J Cell Biol. 2008;182:685–701. - PMC - PubMed
    1. Barrier L, Ingrand S, Damjanac M, Rioux Bilan A, Hugon J, Page G. Genotype-related changes of ganglioside composition in brain regions of transgenic mouse models of Alzheimer's disease. Neurobiol Aging. 2007;28:1863–72. - PubMed

Publication types