Comparative Study
. 2015 Feb;36(2):549-65.
doi: 10.1002/hbm.22646. Epub 2014 Oct 1.

Spatial and temporal functional connectivity changes between resting and attentive states

Affiliations
Comparative Study

Spatial and temporal functional connectivity changes between resting and attentive states

Signe Bray et al. Hum Brain Mapp. 2015 Feb.

Abstract

Remote brain regions show correlated spontaneous activity at rest within well described intrinsic connectivity networks (ICNs). Meta-analytic coactivation studies have uncovered networks similar to resting ICNs, suggesting that in task states connectivity modulations may occur principally within ICNs. However, it has also been suggested that specific "hub" regions dynamically link networks under different task conditions. Here, we used functional magnetic resonance imaging at rest and a continuous visual attention task in 16 participants to investigate whether a shift from rest to attention was reflected by within-network connectivity modulation, or changes in network topography. Our analyses revealed evidence for both modulation of connectivity within the default-mode (DMN) and dorsal attention networks (DAN) between conditions, and identified a set of regions including the temporoparietal junction (TPJ) and posterior middle frontal gyrus (MFG) that switched between the DMN and DAN depending on the task. We further investigated the temporal nonstationarity of flexible (TPJ and MFG) regions during both attention and rest. This showed that moment-to-moment differences in connectivity at rest mirrored the variation in connectivity between tasks. Task-dependent changes in functional connectivity of flexible regions may, therefore, be understood as shifts in the proportion of time specific connections are engaged, rather than a switch between networks per se. This ability of specific regions to dynamically link ICNs under different task conditions may play an important role in behavioral flexibility.

Keywords: attention; connectivity; hubs; networks; resting functional magnetic resonance imaging.


Figures

Figure 1
Figure 1
Six‐cluster solution. Networks derived from rest and attention conditions are shown in the left and middle columns; lateral and medial surfaces of the right hemisphere are shown. The six cluster solution identified the DMN, default mode; DAN, dorsal attention; VAN, ventral attention; SMN, supplementary motor; VIS, visual; SubC, subcortical networks. Significant differences between networks are shown in the rightmost column (left hemisphere on the left); red = rest > attention, blue = attention > rest. [Color figure can be viewed in the online issue, which is available at http://wileyonlinelibrary.com.]
Figure 2
Figure 2
Regions showing significant differences between rest and attention. Across models, regions showing significant differences between rest and attention networks were combined. This map of regions that shift between networks shows broad similarities to the community density map identified in Power et al. (2013; Figure 7) and uncertainty map in Lee et al. (2012; Figure 6). LH, left hemisphere; RH, right hemisphere. [Color figure can be viewed in the online issue, which is available at http://wileyonlinelibrary.com.]
Figure 3
Figure 3
Between‐task differences in seed connectivity for core DMN, DAN, and visual regions. a) Consistency maps indicating consistent regions of significant difference in connectivity between rest and attention tasks, for seeds in the DMN and DAN. Top panel: Regions of significant (P < 0.001 uncorrected) difference between tasks for 1–4 DMN seeds (PCC, mPFC and bilateral IPL). Across 1–4 seeds rest showed greater connectivity with PCC and inferior parietal regions, while attention showed greater connectivity with cingulate, insula and TPJ. Bottom panel: Regions of significant (P < 0.001 uncorrected) difference between tasks for 1–5 DAN seeds (bilateral hFEF, bilateral IPS, SMA). Across 1–5 seeds attention showed stronger connectivity with IPS and hFEF, while rest showed greater connectivity with cingulate, occipitotemporal, SPL, and TPJ. b) Connectivity differences between tasks for core visual seed [2 −84 0], T‐map shown at P < 0.001 uncorrected for display purposes. Warm colors = attention > rest, Cool colors = rest > attention. RH, right hemisphere, LH, left hemisphere; DMN, default mode network; DAN, dorsal attention network; TPJ, temporoparietal junction; PCC, posterior cingulate cortex; mPFC, medial prefrontal cortex; IPL, inferior parietal lobule; hFEF, putative human frontal eye fields; IPS, intraparietal sulcus; SMA, supplementary motor area; SPL, superior parietal lobule. [Color figure can be viewed in the online issue, which is available at http://wileyonlinelibrary.com.]
Figure 4
Figure 4
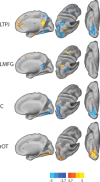
Seed correlation maps for rest versus attention with flexible regions. Color maps indicate T‐values. All shown at P < 0.001 uncorrected for display purposes. Right hemispheres are shown. Warm colors = attention > rest, cool colors = rest > attention. Top panel: LTPJ seed. DMN regions such as PCC and mPFC (in warm colors) showed greater connectivity during attention, while regions of the IPS and hFEF showed greater connectivity at rest (cool colors). Second panel from the top: LMFG seed. DMN regions such as PCC (in cool colors) showed greater connectivity during rest, while regions of the IPS and hFEF showed greater connectivity during attention (warm colors). Second panel from the bottom: Cuneus (C) seed showed stronger connectivity to ventral and dorsal visual regions at rest. Bottom panel: Right occipitotemporal (rOT) seed showed greater connectivity with dorsal and ventral visual regions during attention. Right hemispheres are shown. LTPJ, left temporoparietal junction; LMFG, left middle frontal gyrus; DMN, default mode network; PCC, posterior cingulate cortex, mPFC, medial prefrontal cortex; PC, pericalcaine; rOT, right occipitotemporal; hFEF, putative human frontal eye fields; IPS, intraparietal sulcus. [Color figure can be viewed in the online issue, which is available at http://wileyonlinelibrary.com.]
Figure 5
Figure 5
Temporal nonstationarity of LTPJ connectivity. The middle row shows unthresholded T‐statistic maps for group‐level connectivity results from the LTPJ seed during rest and attention tasks. The spatial correlation between the rest and attention seed maps is 0.35. The top row shows the two temporal clusters during the resting task and the bottom row shows the two temporal clusters during the attention task. Links between temporal clusters and seed connectivity maps indicate the spatial correlation between them. This figure shows that at rest, one temporal cluster is predominantly correlated to the resting seed map, while the other shows a strong correlation to both attention and rest seed maps. The converse is apparent in the bottom row for the temporal clusters during attention. Note that the attention seed map includes PCC and medial PFC regions typically associated with the DMN. These regions are included in the top right resting temporal cluster, but not the leftmost. Top and bottom row color maps indicate standardized deviation from the mean. Left hemispheres are shown. LTPJ, left temporoparietal junction; PCC, posterior cingulate cortex; mPFC, medial prefrontal cortex. [Color figure can be viewed in the online issue, which is available at http://wileyonlinelibrary.com.]
Figure 6
Figure 6
Temporal nonstationarity of LMFG connectivity. The middle row shows unthresholded T‐statistic maps for group‐level connectivity results from the LMFG seed during rest and attention tasks. The spatial correlation between the rest and attention seed maps is 0.67. The top row shows the two temporal clusters during the resting task and the bottom row shows the two temporal clusters during the attention task. Links between temporal clusters and seed connectivity maps indicate the spatial correlation between them. Note that the rest seed map includes PCC and medial PFC regions typically associated with the DMN. These regions are included in the top left resting temporal cluster, but not the rightmost cluster. Top and bottom row color maps indicate standardized deviation from the mean. Left hemispheres are shown. LMFG, left middle frontal gyrus; DMN, default mode network; PCC, posterior cingulate cortex; PFC, prefrontal cortex. [Color figure can be viewed in the online issue, which is available at http://wileyonlinelibrary.com.]
Figure 7
Figure 7
Temporal nonstationarity of cuneus seed connectivity. The middle row shows unthresholded T‐statistic maps for group‐level connectivity results from the cuneus seed during rest and attention tasks. The spatial correlation between the rest and attention seed maps is 0.58. The top row shows the two temporal clusters during the resting task and the bottom row shows the two temporal clusters during the attention task. Links between temporal clusters and seed connectivity maps indicate the spatial correlation between them. Note that at rest there is greater recruitment of dorsal and ventral visual regions, relative to attention, consistent with differences shown in Figure 3. This between‐task difference is reflected in the two temporal clusters seen at rest, the leftmost of which shows more extensive dorsal and ventral visual regions. Top and bottom row color maps indicate standardized deviation from the mean. Left hemispheres are shown. [Color figure can be viewed in the online issue, which is available at http://wileyonlinelibrary.com.]

References

    1. Al‐Aidroos N, Said CP, Turk‐Browne NB (2012): Top‐down attention switches coupling between low‐level and high‐level areas of human visual cortex. Proc Natl Acad Sci USA 109:14675–14680. - PMC - PubMed
    1. Allen EA, Damaraju E, Plis SM, Erhardt EB, Eichele T, Calhoun VD (2014): Tracking whole‐brain connectivity dynamics in the resting state. Cereb Cortex 24:663–676. - PMC - PubMed
    1. Arbabshirani MR, Havlicek M, Kiehl KA, Pearlson GD, Calhoun VD (2013): Functional network connectivity during rest and task conditions: A comparative study. Hum Brain Mapp 34:2959–2971. - PMC - PubMed
    1. Arnold AE, Protzner AB, Bray S, Levy RM, Iaria G (2014): Neural network configuration and efficiency underlies individual differences in spatial orientation ability. J Cogn Neurosci 26:380–394. - PubMed
    1. Betti V, Della Penna S, de Pasquale F, Mantini D, Marzetti L, Romani GL, Corbetta M (2013): Natural scenes viewing alters the dynamics of functional connectivity in the human brain. Neuron 79:782–797. - PMC - PubMed

Publication types