Review
. 2014 Sep 30;19(10):15824-65.
doi: 10.3390/molecules191015824.

A starting point for fluorescence-based single-molecule measurements in biomolecular research

Affiliations
Review

A starting point for fluorescence-based single-molecule measurements in biomolecular research

Alexander Gust et al. Molecules. .

Abstract

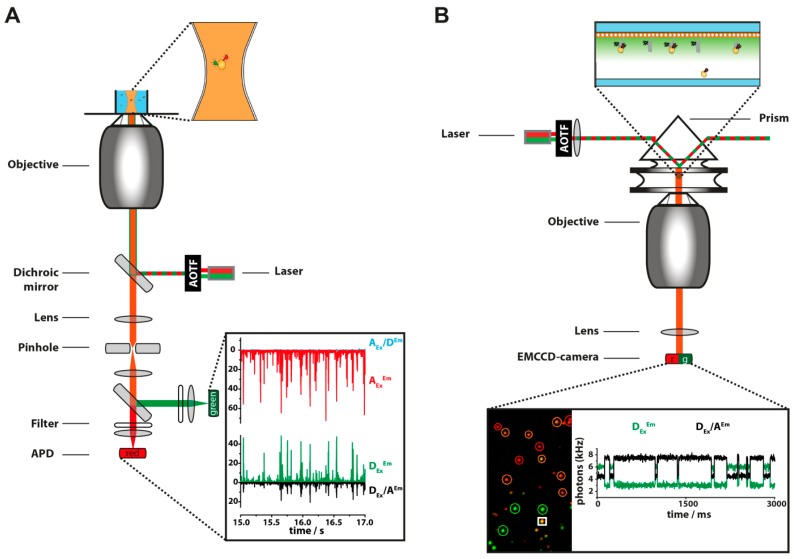
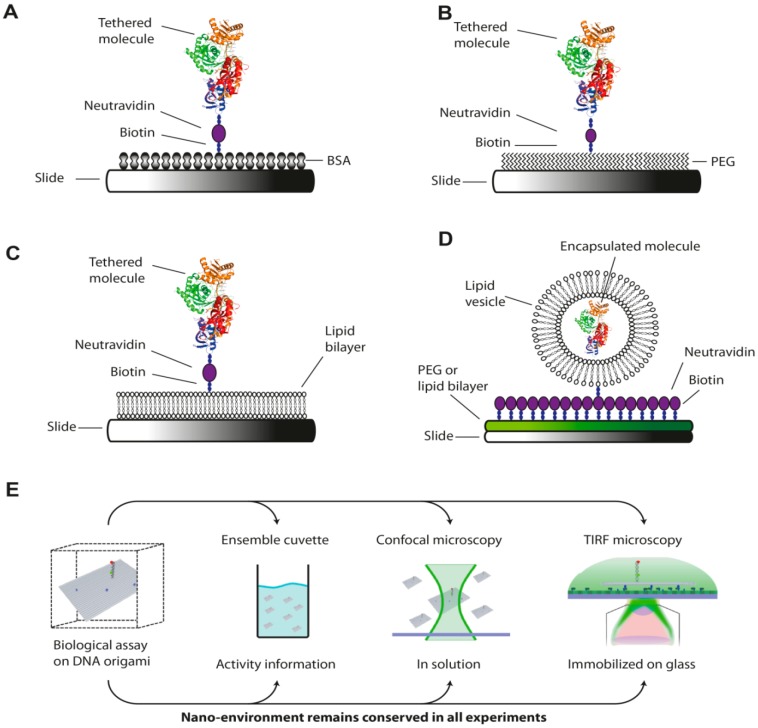
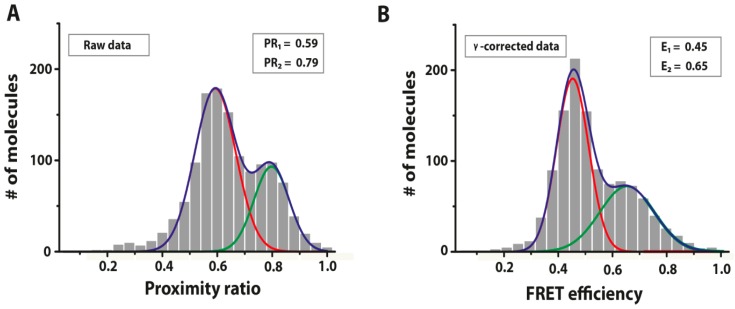
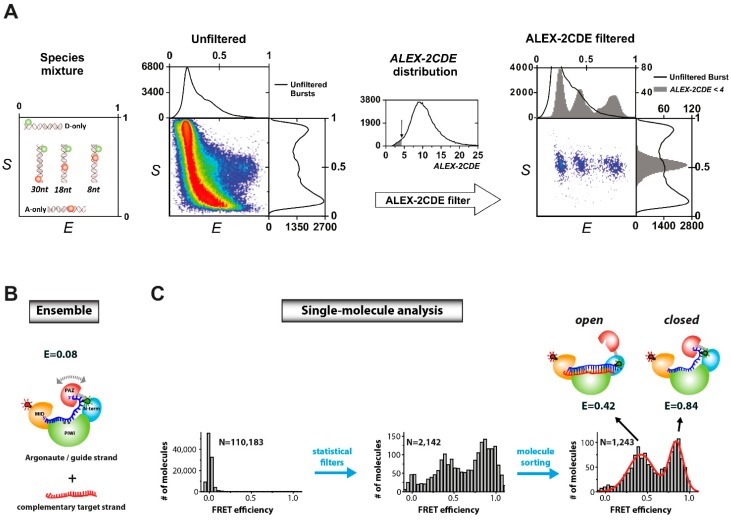
Single-molecule fluorescence techniques are ideally suited to provide information about the structure-function-dynamics relationship of a biomolecule as static and dynamic heterogeneity can be easily detected. However, what type of single-molecule fluorescence technique is suited for which kind of biological question and what are the obstacles on the way to a successful single-molecule microscopy experiment? In this review, we provide practical insights into fluorescence-based single-molecule experiments aiming for scientists who wish to take their experiments to the single-molecule level. We especially focus on fluorescence resonance energy transfer (FRET) experiments as these are a widely employed tool for the investigation of biomolecular mechanisms. We will guide the reader through the most critical steps that determine the success and quality of diffusion-based confocal and immobilization-based total internal reflection fluorescence microscopy. We discuss the specific chemical and photophysical requirements that make fluorescent dyes suitable for single-molecule fluorescence experiments. Most importantly, we review recently emerged photoprotection systems as well as passivation and immobilization strategies that enable the observation of fluorescently labeled molecules under biocompatible conditions. Moreover, we discuss how the optical single-molecule toolkit has been extended in recent years to capture the physiological complexity of a cell making it even more relevant for biological research.


Conflict of interest statement

The authors declare no conflict of interest.

Figures

Figure 1
Figure 1
Structure and dimensions of (A) the fluorescent protein eGFP (PDB: 4EUL), chromophore highlighted in red); and (B) the organic dye Alexa488 (blue) with linker (turquois); (C) Coupled to a biomolecule (shown here are RNA polymerase subunits Rpo4/7, PDB: 1GO3, blue and magenta ribbons) the organic dye is restricted in its rotational freedom and samples a defined volume. The dye is attached to different positions of the protein to illustrate how the rotational freedom of the dyes is restricted depending on the protein structure. The conformational space available for the linker-dye molecules can be computed using Monte-Carlo simulations. Clouds envelope 99.5% (gray) and 50% (red) of the total probability (Adapted by permission from PLOS ONE: D. Klose et al., published: 25 June 2012, doi:10.1371/journal.pone.0039492).
Figure 2
Figure 2
(A) Jablonski diagram: once an organic dye absorbs a photon it is excited from the ground state S0 to the first excited singlet state S1 (kex) and can return to S0 by emission of a photon (kfl, fluorescence). The dye can undergo numerous excitation-emission cycles before it enters a non-fluorescent triplet state T1 via intersystem crossing (kISC). Once in the triplet state, the dye can either return directly to S0 (kt) via different, competing pathways or can be destroyed by singlet oxygen (photobleaching). The reduction of the dye in its triplet state to a non-fluorescent radical anion A (kred, red), which can subsequently be oxidized (kox, blue) promotes the depopulation of T1 to S0. The depopulation of the triplet state can also start with the oxidation reaction followed by the reduction step; (BD) Exemplary photophysical behavior of organic dyes. Fluorescence transients of Cy5-labeled dsDNA in aqueous PBS buffer (B). The removal of oxygen leads to reduced triplet quenching and increased blinking. (C) Addition of 2 mM Trolox(TX)/Troloxquinone (TXQ) enables stable and prolonged fluorescence over minutes (D). Photostabilization by the “geminate recombination” mechanism [48] (E). A time series of frames showing the photostability of Alexa568 dyes in different buffers (2 mM TX/TXQ, left column; 1% beta-mercaptoethanol (ME; center), and a combination of both (right column)), oxygen was removed in all cases (see text for details). Scale bar: 10 μm. The last row shows transients from a confocal microscope that illustrate the differences in blinking and photobleaching behavior of the dye. (F) Total number of detected photons before photobleaching or long-lived dark states for the dyes Alexa568 and ATTO647N in different buffers (figures in panel A, E and F adapted by permission from Holzmeister et al., Geminate recombination as a photoprotection mechanism for fluorescent dyes, Angewandte Chemie, 2014).
Figure 3
Figure 3
Principles of fluorescence resonance energy transfer (FRET). (A) If an excited donor fluorophore is in close proximity (approximately 1–10 nm) to an acceptor fluorophore, radiation-less energy transfer to the acceptor fluorophore via dipole-dipole interaction (FRET) competes with radiative return (photon emission) of the donor to its ground state (dotted arrow). The acceptor, now in its excited state (S1), can then return to its ground state (S0) by the emission of a photon and the ratio of photons emitted by the donor and acceptor molecule defines the transfer efficiency; (B) FRET occurs only if the emission spectrum of the donor dye (green continuous line, Alexa555) overlaps with excitation spectrum of the acceptor dye (red dashed line, Alexa647); (C) Distance dependency of the energy transfer efficiency between a donor and acceptor fluorophore (assuming a Förster radius R0 of 5 nm). FRET can inform for example about structural changes in the DNA induced by the transcription factor TBP (TATA-binding protein) [49]. Distance changes can be measured most sensitively when working in the dynamic range between approximately 10%–90% FRET efficiency (dotted lines).
Figure 4
Figure 4
(A) Typical fluorescence transients of immobilized dsDNA labeled with a donor (Cy3B) and an acceptor dye (ATTO647N) allowing FRET. Using alternating laser excitation the acceptor emission upon acceptor excitation is recorded in addition to the FRET signal. The donor fluorescence is shown in green, the acceptor in red and the FRET intensity in black, respectively. Upon bleaching of the acceptor dye (32 s) no fluorescence is emitted by the acceptor and the donor fluorescence increases because of the inhibited energy transfer. Simultaneously, the FRET efficiency is reduced to zero. (B) The Holliday Junction (HJ) is composed of four single stranded DNAs that can adopt two different conformations, IsoI or IsoII (B). (C) Fluorescence time transient of a Cy3B-ATTO647N labeled HJ that undergoes conformational changes (TIRF measurement). The HJ is immobilized on a PEG surface in PBS with 200 mM MgCl2 added to the buffer. The FRET efficiency (lower trace, blue) changes rapidly between a low FRET and a high FRET state and at the same time Cy3B and ATTO647N fluorescence intensities show an anti-correlated behavior (upper trace, donor in green, acceptor in red, FRET in blue) until the acceptor bleaches. A double-Gaussian fit of the histogram reveals FRET values Elow FRET = 0.29 for conformation IsoI and Ehigh FRET = 0.70 for conformation IsoII; (D) The fluorescence of ATTO647N is quenched when it can directly interact with the donor fluorophore Cy3B. The quenching effect leads to a slightly decreased FRET efficiency [59] as compared to the FRET efficiency retrieved from a HJ with the FRET pair Cy3/Cy5 (a dye pair known to not directly interact); (E) ATTO647N can change its emission characteristics due to spectral shifts [39] potentially causing deviations in the FRET efficiency as shown by Di Fiori et al. [59].
Figure 5
Figure 5
(A) Two-color confocal microscopy setup: Green and red excitation lasers are combined and alternated with an acousto-optical tunable filter (AOTF) in order to excite a molecule several times with each laser during its diffusion through the focal volume. The objective focuses the light on a diffraction limited spot in solution. Only molecules that diffuse through this confocal volume are excited. In order to further confine the detection volume, the fluorescence is focused through a pinhole followed by a separation by a dichroic beam splitter onto the donor (green) and acceptor (red) detection channel by appropriate spectral filters. These photons, recorded by the avalanche photodiodes (APDs), can be assigned to four channels: acceptor excitation/donor emission (blue), acceptor excitation/acceptor emission (red), donor excitation/donor emission (green) and donor excitation/acceptor emission (FRET channel, black); (B) Two-color total internal fluorescence reflection microscopy. In contrast to confocal microscopy an area (approximately 50 × 50 µm2) is illuminated which requires higher laser power. After combining and alternating the lasers, their beams are focused by a lens and refracted by a prism (incident angle has to be larger than 63°) onto the upper side of a flow chamber. This way an exponentially decaying evanescent field is generated and only molecules in close proximity to the quartz slide are excited. The resulting fluorescence is collected by a water objective and directed to a beam splitter, which separates the fluorescence according to their wavelength. A lens-mirror system projects the donor and the acceptor fluorescence spatially shifted onto an EMCCD camera chip. By software aided superposition of both areas, subpopulations can be identified (green circles: donor only, red circles: acceptor only, orange circles: donor and acceptor) and the fluorescence signal of the molecules can be monitored over time (signal of the molecule in the white square).
Figure 6
Figure 6
Immobilization and passivation strategies for single-molecule measurements on surface-tethered molecules. Passivation of the glass slide prevents the unspecific attachment of the molecule of interest and is usually realized using biocompatible reagents like (A) bovine serum albumin (BSA); (B) polyethylene glycol (PEG) or (C,D) lipids. Mixing of the passivation reagent with its biotinylated counterpart and addition of neutravidin allows the immobilization of the molecule of interest via a biotin-neutravidin linkage on the passivated surface; (E) More elaborated strategies make use of pseudo-surfaces like DNA origami. The DNA origami serves as transportable and biocompatible platform that allows the matching of ensemble and single-molecule measurements (see text for details) [104]. (Figure in panel E adapted by permission from Oxford University Press. Gietl, A., et al., 2012 “DNA origami as biocompatible surface to match single-molecule and ensemble experiments”. Nucleic Acids Research 40(14): e110. Figure 1B).
Figure 7
Figure 7
Analysis of single-molecule data to retrieve quantitative distance information. (A) After correction of the fluorescence intensities values for direct excitation of the acceptor with the donor excitation laser and cross-talk of the donor emission into the acceptor detection channel a proximity ratio histogram can be obtained. The exemplary histogram was obtained from a protein with two different conformations (unpublished data) resulting in two populations. The data are fitted with two Gaussian s with peaks at 0.59 and 0.79; (B) In order to retrieve absolute FRET values a γ -correction has to be carried out. Gaussian fitting of the resulting γ-corrected FRET efficiency histogram reveals that the corrected FRET efficiencies drastically deviate from the uncorrected data (E = 0.45/0.69).
Figure 8
Figure 8
(A) Advanced statistical analysis of single-molecule FRET data acquired using confocal microscopy with alternating laser excitation (ALEX) [142]. The ALEX-2CDE filter uncovers a minor, doubly labeled dsDNA subpopulation hidden in the larger concentrations of singly labeled dsDNA subpopulations [30 pM donor-labeled and 30 pM acceptor-labeled ssDNA with three different doubly labeled dsDNA, 6 pM each (E = 0.22, E = 0.46, and E = 0.85)]. (Adapted from Tomov, T. E. et al., 2012 “Disentangling subpopulations in single-molecule FRET and ALEX experiments with photon distribution analysis”. Biophysical Journal 102(5): 1163–1173); (B) In order to understand the conformational transitions of the Argonaute-protein a donor-acceptor pair (AttoATTO550/Alexa647) was engineered into the protein-nucleic acid complex. In ensemble measurements a surprisingly low FRET efficiency of 0.08 was determined; (C) When measured at the single-molecule level a comparable low FRET efficiency was measured. However, unlike in ensemble, the single-molecule approach revealed that the low FRET efficiency is due to a large access of donor-only and acceptor-only labeled molecules in the sample. Statistical filters gave access to the 1% of molecules that exhibit a stable FRET signal. Ultimately, this revealed that Argonaute adopts a different conformation (E = 0.42) when the target strand is loaded as compared to the Argonaute-guide DNA only complex, which is characterized by a high FRET value (E = 0.84).

References

    1. Funatsu T., Harada Y., Tokunaga M., Saito K., Yanagida T. Imaging of single fluorescent molecules and individual atp turnovers by single myosin molecules in aqueous solution. Nature. 1995;374:555–559. - PubMed
    1. Jain A., Liu R., Ramani B., Arauz E., Ishitsuka Y., Ragunathan K., Park J., Chen J., Xiang Y.K., Ha T. Probing cellular protein complexes using single-molecule pull-down. Nature. 2011;473:484–488. - PMC - PubMed
    1. Wang Q., Moerner W.E. Single-molecule motions enable direct visualization of biomolecular interactions in solution. Nat. Methods. 2014;11:555–558. - PubMed
    1. Zhang Z., Revyakin A., Grimm J.B., Lavis L.D., Tjian R. Single-molecule tracking of the transcription cycle by sub-second rna detection. Elife. 2014;3:e01775. - PMC - PubMed
    1. Tsai A., Petrov A., Marshall R.A., Korlach J., Uemura S., Puglisi J.D. Heterogeneous pathways and timing of factor departure during translation initiation. Nature. 2012;487:390–393. - PMC - PubMed

Publication types

MeSH terms

Substances