

Optimal allocation of resources in female sex worker targeted HIV prevention interventions: model insights from Avahan in South India
- PMID: 25271808
- PMCID: PMC4182672
- DOI: 10.1371/journal.pone.0107066
Optimal allocation of resources in female sex worker targeted HIV prevention interventions: model insights from Avahan in South India
Abstract
Background: The Avahan programme has provided HIV prevention activities, including condom promotion, to female sex workers (FSWs) in southern India since 2004. Evidence suggests Avahan averted 202,000 HIV infections over 4 years. For replicating this intervention elsewhere, it is essential to understand how the intervention's impact could have been optimised for different budget levels.
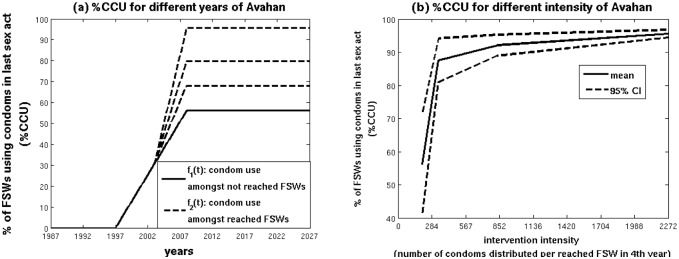
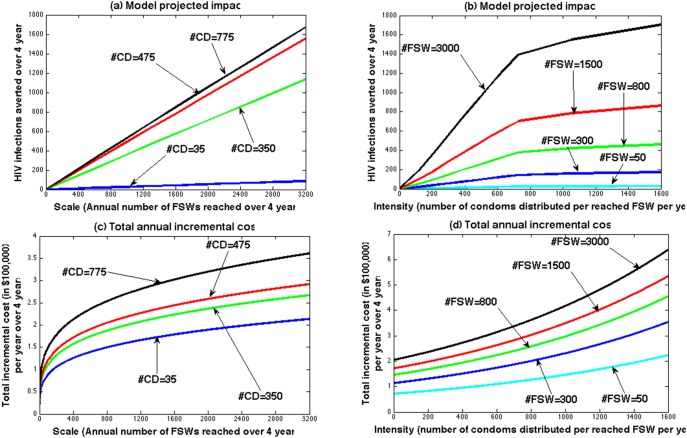
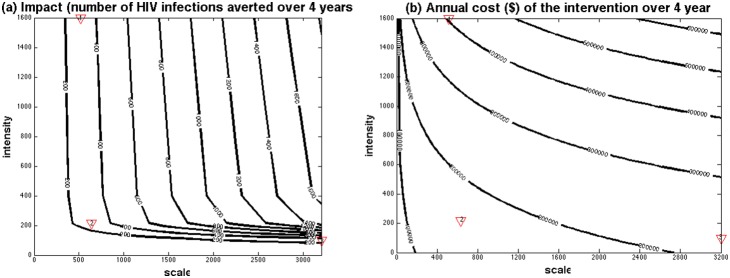
Methods: Behavioural data were used to determine how condom use varied for FSWs with different levels of intervention intensity. Cost data from 64 Avahan districts quantified how district-level costs related to intervention scale and intensity. A deterministic model for HIV transmission amongst FSWs and clients projected the impact and cost of intervention strategies for different scale and intensity, and identified the optimal strategies that maximise impact for different budget levels.
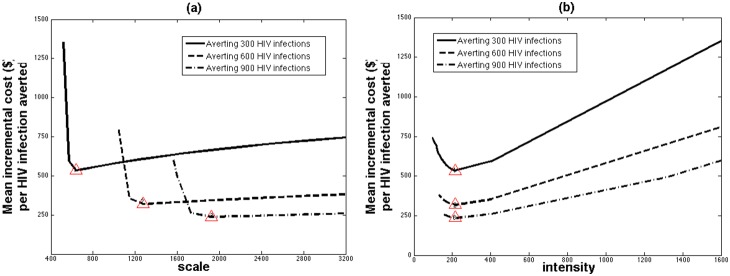
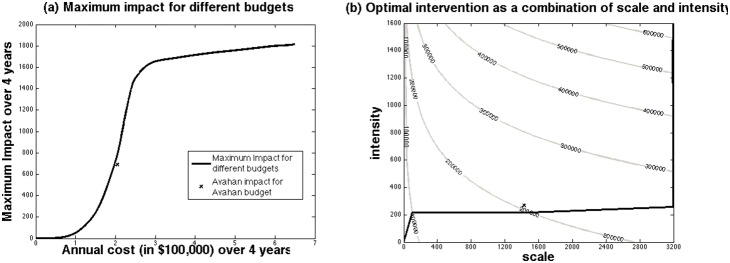
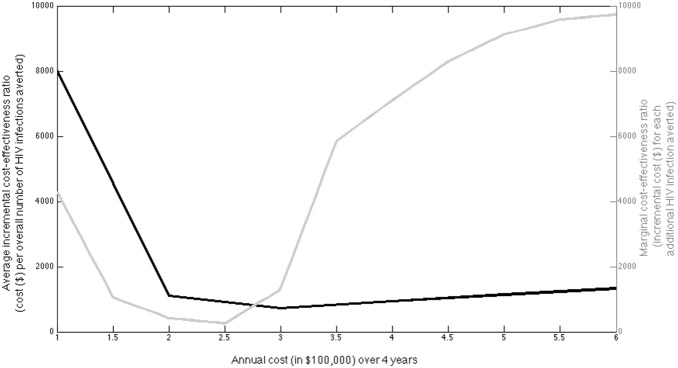
Results: As budget levels increase, the optimal intervention strategy is to first increase intervention intensity which achieves little impact, then scale-up coverage to high levels for large increases in impact, and lastly increase intensity further for small additional gains. The cost-effectiveness of these optimal strategies generally improves with increasing resources, while straying from these strategies can triple costs for the same impact. Projections suggest Avahan was close to being optimal, and moderate budget reductions (≥ 20%) would have reduced impact considerably (>40%).
Discussion: Our analysis suggests that tailoring the design of HIV prevention programmes for FSWs can improve impact, and that a certain level of resources are required to achieve demonstrable impact. These insights are critical for optimising the use of limited resources for preventing HIV.
Conflict of interest statement
Figures
Similar articles
-
Assessment of the population-level effectiveness of the Avahan HIV-prevention programme in South India: a preplanned, causal-pathway-based modelling analysis.Lancet Glob Health. 2013 Nov;1(5):e289-99. doi: 10.1016/S2214-109X(13)70083-4. Epub 2013 Sep 30. Lancet Glob Health. 2013. PMID: 25104493
-
Positive impact of a large-scale HIV prevention programme among female sex workers and clients in South India.AIDS. 2013 Jun 1;27(9):1449-60. doi: 10.1097/QAD.0b013e32835fba81. AIDS. 2013. PMID: 23462221 Free PMC article.
-
Condom use and prevalence of syphilis and HIV among female sex workers in Andhra Pradesh, India - following a large-scale HIV prevention intervention.BMC Public Health. 2011 Dec 29;11 Suppl 6(Suppl 6):S1. doi: 10.1186/1471-2458-11-S6-S1. BMC Public Health. 2011. PMID: 22376071 Free PMC article.
-
Evaluation design for large-scale HIV prevention programmes: the case of Avahan, the India AIDS initiative.AIDS. 2008 Dec;22 Suppl 5:S1-15. doi: 10.1097/01.aids.0000343760.70078.89. AIDS. 2008. PMID: 19098469 Review.
-
Global epidemiology of HIV among female sex workers: influence of structural determinants.Lancet. 2015 Jan 3;385(9962):55-71. doi: 10.1016/S0140-6736(14)60931-4. Epub 2014 Jul 22. Lancet. 2015. PMID: 25059947 Free PMC article. Review.
Cited by
-
Implementation of the Good School Toolkit in Uganda: a quantitative process evaluation of a successful violence prevention program.BMC Public Health. 2018 May 9;18(1):608. doi: 10.1186/s12889-018-5462-1. BMC Public Health. 2018. PMID: 29743105 Free PMC article. Clinical Trial.
-
Maximising HIV prevention by balancing the opportunities of today with the promises of tomorrow: a modelling study.Lancet HIV. 2016 Jul;3(7):e289-96. doi: 10.1016/S2352-3018(16)30036-4. Lancet HIV. 2016. PMID: 27365203 Free PMC article.
-
Kazakhstan can achieve ambitious HIV targets despite expected donor withdrawal by combining improved ART procurement mechanisms with allocative and implementation efficiencies.PLoS One. 2017 Feb 16;12(2):e0169530. doi: 10.1371/journal.pone.0169530. eCollection 2017. PLoS One. 2017. PMID: 28207809 Free PMC article.
-
Cost effectiveness of HIV and sexual reproductive health interventions targeting sex workers: a systematic review.Cost Eff Resour Alloc. 2018 Dec 4;16:63. doi: 10.1186/s12962-018-0165-0. eCollection 2018. Cost Eff Resour Alloc. 2018. PMID: 30524207 Free PMC article. Review.
-
Strengthening India's Response to HIV/AIDS Epidemic Through Strategic Planning, Innovative Financing, and Mathematical Modeling: Key Achievements over the Last 3 Decades.J Indian Inst Sci. 2022;102(2):791-809. doi: 10.1007/s41745-022-00331-y. Epub 2022 Sep 7. J Indian Inst Sci. 2022. PMID: 36093271 Free PMC article. Review.
References
-
- World Health Organization, Joint United Nations Programme on HIV/AIDS (UNAIDS and United Nations Children’s Fund (2011) Progress Report 2011: Global HIV/AIDS Response (Geneva: World Health Organization). Available: http://www.who.int/hiv/pub/progress_report2011/en/index.html. Accessed 2014 August 24.
-
- UNAIDS World AIDS day Report 2012. Available: http://www.unaids.org/en/media/unaids/contentassets/documents/epidemiolo... dAIDSday_results_en.pdf. Accessed 2014 August 24.
-
- The International Labour Organization (ILO), National AIDS Control Organization (2007) Targeted Interventions for High Risk Groups (HRGs): Operational guidelines. Available: http://www.ilo.org/wcmsp5/groups/public/@ed_protect/@protrav/@ilo_aids/d... s_117312.pdf. Accessed 2014 August 24.
-
- Baral SD, Beyrer C, Muessig K, Poteat T, Wirtz AL, et al. (2012) Burden of HIV among female sex workers in low-income and middle-income countries: a systematic review and meta-analysis. Lancet Infect Dis. 12(7): 538–549. - PubMed
-
- Mishra S, Pickles M, Blanchard JF, Moses S, Boily MC (2014) Distinguishing sources of HIV transmission from the distribution of newly acquired HIV infections: why is it important for HIV prevention planning? Sex Transm Infect. 90(1): 19–25. - PubMed
Publication types
MeSH terms
Grants and funding
LinkOut - more resources
Full Text Sources
Other Literature Sources
Medical
Research Materials
