. 2014 Dec 1;71(12):1323-31.
doi: 10.1001/jamapsychiatry.2014.1582.

Prefrontal cortical dendritic spine pathology in schizophrenia and bipolar disorder

Affiliations

Prefrontal cortical dendritic spine pathology in schizophrenia and bipolar disorder

Glenn T Konopaske et al. JAMA Psychiatry. .

Abstract

Importance: Prior studies have demonstrated reduced dendritic spine density in the dorsolateral prefrontal cortex (DLPFC) in schizophrenia. However, it remains unclear how generalizable this finding is in schizophrenia and if it is seen in bipolar disorder, a historically distinct psychiatric condition.

Objective: To assess whether spine loss is present in the DLPFC of individuals with schizophrenia and individuals with bipolar disorder.

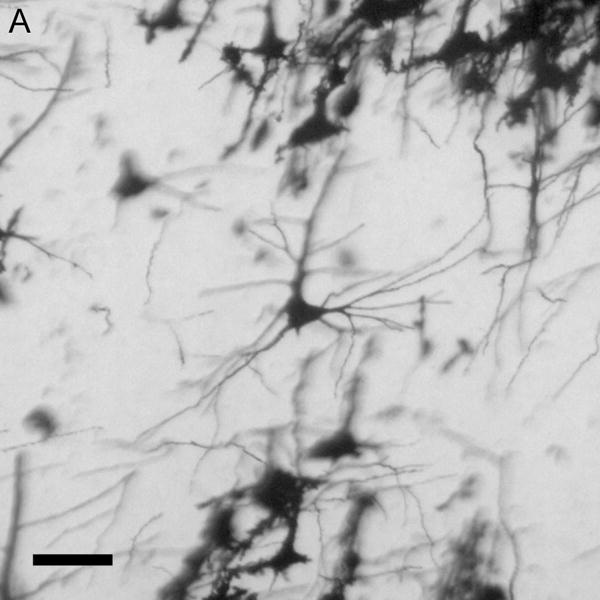
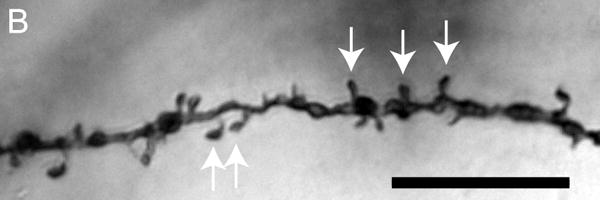
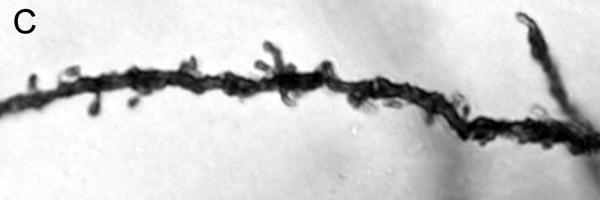
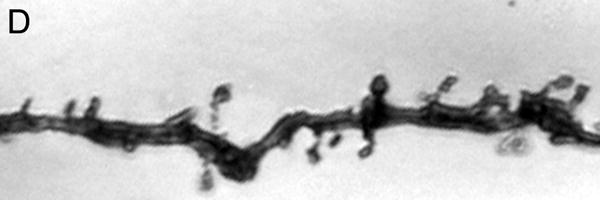
Design, setting, and participants: This study used postmortem human brain tissue from individuals with schizophrenia (n=14), individuals with bipolar disorder (n=9), and unaffected control participants (n=19). Tissue samples containing the DLPFC (Brodmann area 46) were Golgi-stained, and basilar dendrites of pyramidal cells in the deep half of layer III were reconstructed.

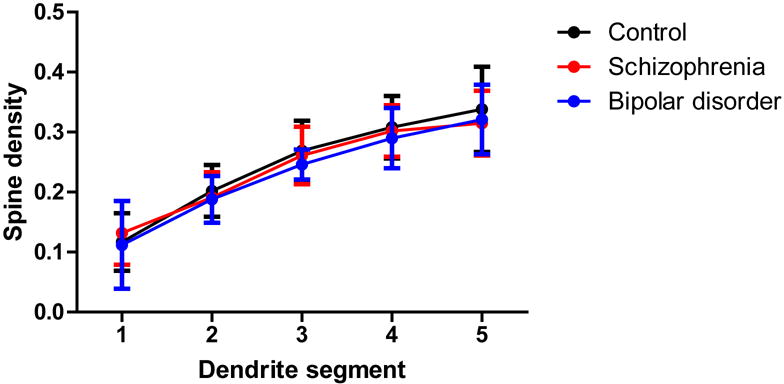
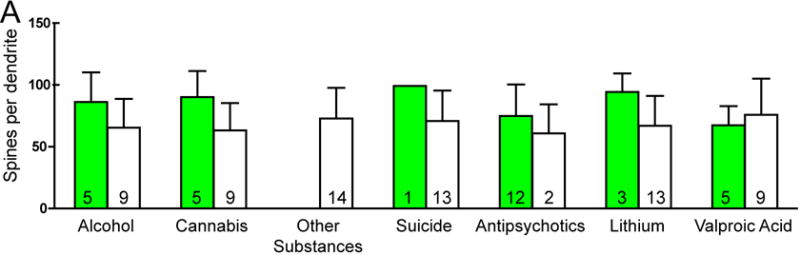
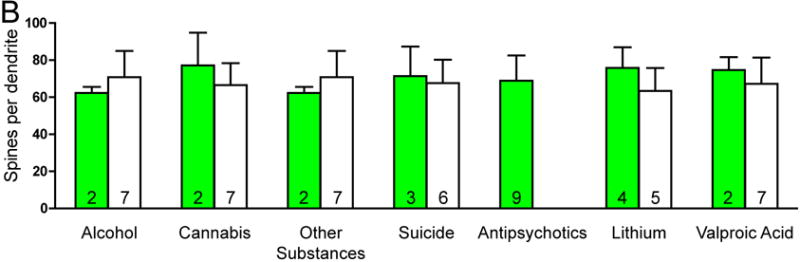
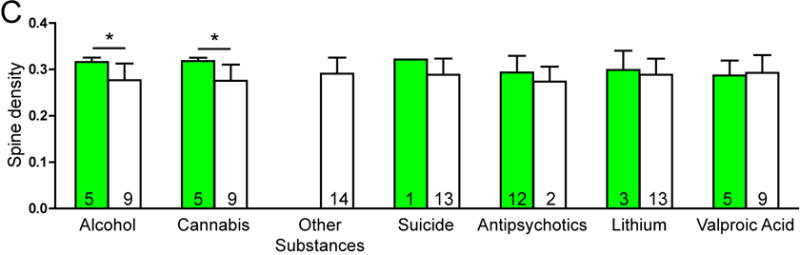
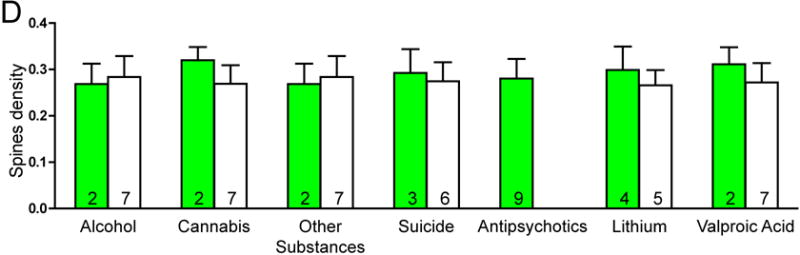
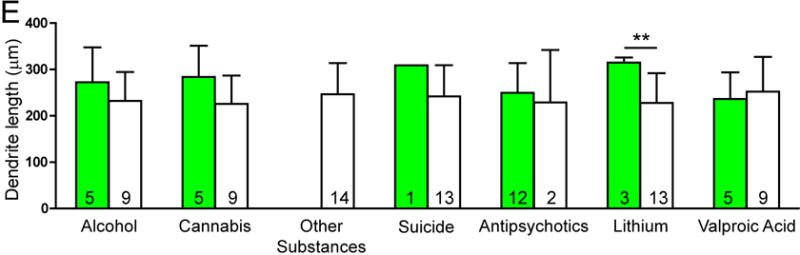
Main outcomes and measures: The number of spines per dendrite, spine density, and dendrite length were compared across groups. We also assessed for the potential effects of clinical and demographic variables on dendritic parameters.

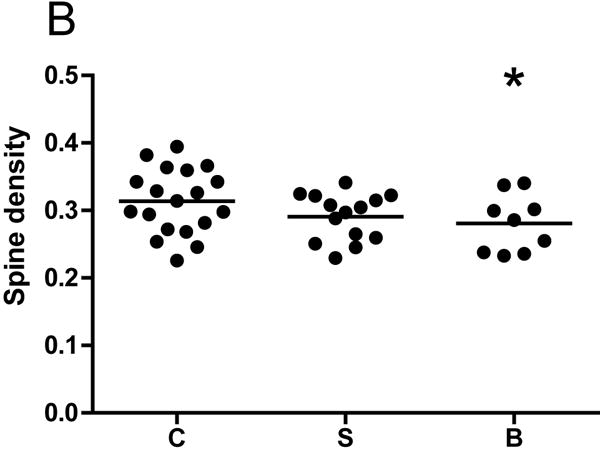
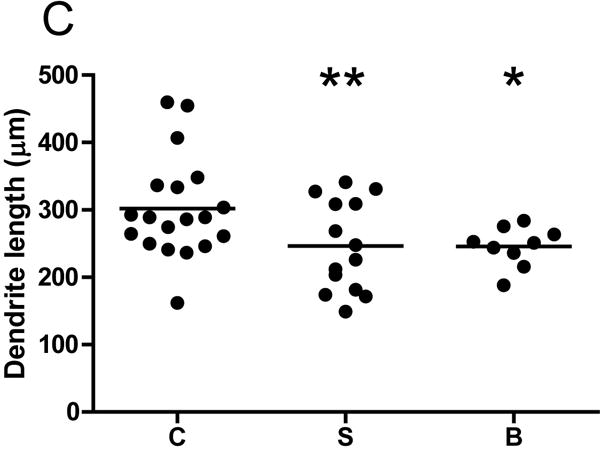
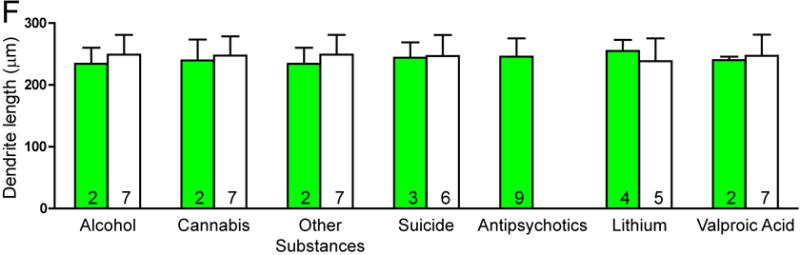
Results: The mean (SD) spine density was significantly reduced (ie, by 10.5%) in individuals with bipolar disorder (0.28 [0.04] spines/μm) compared with control participants (0.31 [0.05] spines/μm) (P=.02). In individuals with schizophrenia, the mean (SD) spine density was also reduced (by 6.5%; 0.29 [0.03] spines/μm) but just missed significance when compared with control participants (P=.06). There was a significant reduction in the mean (SD) number of spines per dendrite in both individuals with schizophrenia (72.8 [24.9] spines per dendrite) and individuals with bipolar disorder (68.9 [12.9] spines per dendrite) compared with controls (92.8 [31.1] spines per dendrite) (individuals with schizophrenia vs controls: 21.6% reduction [P=.003]; individuals with bipolar disorder vs controls: 25.8% reduction [P=.005]). In addition, both individuals with schizophrenia and individuals with bipolar disorder had a reduced mean (SD) dendrite length (246.5 [67.4] and 245.6 [29.8] μm, respectively) compared with controls (301.8 [75.1] μm) (individuals with schizophrenia vs controls: 18.3% reduction [P=.005]; individuals with bipolar disorder vs controls: 18.6% reduction [P=.005]).

Conclusions and relevance: Dendritic spine loss in the DLPFC was seen in both individuals with schizophrenia and individuals with bipolar disorder, suggesting that the 2 disorders may share some common pathophysiological features.


Conflict of interest statement

Potential conflicts of interest: GTK, NL, and FMB-nothing to declare. JTC served as a consultant for Abbvie Laboratories and En Vivo.

Figures

Figure 1
Figure 1
Brightfield photomicrographs of Golgi-stained pyramidal cells having their somata localized in the deep half of layer III. Low power image from a control subject (A). High power images of basilar dendrites from a control subject (B), schizophrenia subject (C) and a bipolar disorder subject (D). Scale bar=50 μm for panel A and 10 μm for panel B.
Figure 1
Figure 1
Brightfield photomicrographs of Golgi-stained pyramidal cells having their somata localized in the deep half of layer III. Low power image from a control subject (A). High power images of basilar dendrites from a control subject (B), schizophrenia subject (C) and a bipolar disorder subject (D). Scale bar=50 μm for panel A and 10 μm for panel B.
Figure 2
Figure 2
Graphs representing dendritic parameters for DLPFC deep layer III pyramidal cells. The number of spines per dendrite (A), spine density (B), dendrite length (C), and spine density per dendrite segment (D). Data were obtained from reconstructions of Golgi-stained pyramidal cells. C=control, S=schizophrenia, and B=bipolar disorder; * = p <0.05 relative to controls, ** = p <0.01 relative to controls.
Figure 2
Figure 2
Graphs representing dendritic parameters for DLPFC deep layer III pyramidal cells. The number of spines per dendrite (A), spine density (B), dendrite length (C), and spine density per dendrite segment (D). Data were obtained from reconstructions of Golgi-stained pyramidal cells. C=control, S=schizophrenia, and B=bipolar disorder; * = p <0.05 relative to controls, ** = p <0.01 relative to controls.
Figure 3
Figure 3
Graphs representing dendritic parameters for DLPFC deep layer III pyramidal cells. The number of spines per dendrite (A), spine density (B), dendrite length (C), and spine density per dendrite segment (D). Data were obtained from reconstructions of Golgi-stained pyramidal cells. C=control, S=schizophrenia, and B=bipolar disorder; * = p <0.05 relative to controls, ** = p <0.01 relative to controls.

References

    1. Sekino Y, Kojima N, Shirao T. Role of actin cytoskeleton in dendritic spine morphogenesis. Neurochem Int. 2007 Jul-Sep;51(2–4):92–104. - PubMed
    1. Garey LJ, Ong WY, Patel TS, et al. Reduced dendritic spine density on cerebral cortical pyramidal neurons in schizophrenia. J Neurol Neurosurg Psychiatry. 1998 Oct;65(4):446–453. - PMC - PubMed
    1. Glantz LA, Lewis DA. Decreased dendritic spine density on prefrontal cortical pyramidal neurons in schizophrenia. Arch Gen Psychiatry. 2000 Jan;57(1):65–73. - PubMed
    1. Rao SG, Williams GV, Goldman-Rakic PS. Isodirectional tuning of adjacent interneurons and pyramidal cells during working memory: evidence for microcolumnar organization in PFC. J Neurophysiol. 1999 Apr;81(4):1903–1916. - PubMed
    1. Rao SG, Williams GV, Goldman-Rakic PS. Destruction and creation of spatial tuning by disinhibition: GABA(A) blockade of prefrontal cortical neurons engaged by working memory. J Neurosci. 2000 Jan 1;20(1):485–494. - PMC - PubMed

Publication types