A new role for carbonic anhydrase 2 in the response of fish to copper and osmotic stress: implications for multi-stressor studies
- PMID: 25272015
- PMCID: PMC4182668
- DOI: 10.1371/journal.pone.0107707
A new role for carbonic anhydrase 2 in the response of fish to copper and osmotic stress: implications for multi-stressor studies
Abstract
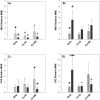
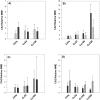
The majority of ecotoxicological studies are performed under stable and optimal conditions, whereas in reality the complexity of the natural environment faces organisms with multiple stressors of different type and origin, which can activate pathways of response often difficult to interpret. In particular, aquatic organisms living in estuarine zones already impacted by metal contamination can be exposed to more severe salinity variations under a forecasted scenario of global change. In this context, the present study aimed to investigate the effect of copper exposure on the response of fish to osmotic stress by mimicking in laboratory conditions the salinity changes occurring in natural estuaries. We hypothesized that copper-exposed individuals are more sensitive to osmotic stresses, as copper affects their osmoregulatory system by acting on a number of osmotic effector proteins, among which the isoform two of the enzyme carbonic anhydrase (CA2) was identified as a novel factor linking the physiological responses to both copper and osmotic stress. To test this hypothesis, two in vivo studies were performed using the euryhaline fish sheepshead minnow (Cyprinodon variegatus) as test species and applying different rates of salinity transition as a controlled way of dosing osmotic stress. Measured endpoints included plasma ions concentrations and gene expression of CA2 and the α1a-subunit of the enzyme Na+/K+ ATPase. Results showed that plasma ions concentrations changed after the salinity transition, but notably the magnitude of change was greater in the copper-exposed groups, suggesting a sensitizing effect of copper on the responses to osmotic stress. Gene expression results demonstrated that CA2 is affected by copper at the transcriptional level and that this enzyme might play a role in the observed combined effects of copper and osmotic stress on ion homeostasis.
Conflict of interest statement
Figures


Similar articles
-
Effects of copper on osmoregulation in sheepshead minnow, Cyprinodon variegatus acclimated to different salinities.Aquat Toxicol. 2012 Mar;109:111-7. doi: 10.1016/j.aquatox.2011.12.005. Epub 2011 Dec 14. Aquat Toxicol. 2012. PMID: 22210499
-
mRNA Expression and activity of ion-transporting proteins in gills of the blue crab Callinectes sapidus: effects of waterborne copper.Environ Toxicol Chem. 2011 Jan;30(1):206-11. doi: 10.1002/etc.370. Environ Toxicol Chem. 2011. PMID: 20928920
-
Effects of waterborne copper delivered under two different exposure and salinity regimes on osmotic and ionic regulation in the mudflat fiddler crab, Minuca rapax (Ocypodidae, Brachyura).Ecotoxicol Environ Saf. 2017 Sep;143:201-209. doi: 10.1016/j.ecoenv.2017.05.042. Epub 2017 May 24. Ecotoxicol Environ Saf. 2017. PMID: 28550807
-
Osmotic stress sensing and signaling in fishes.FEBS J. 2007 Nov;274(22):5790-8. doi: 10.1111/j.1742-4658.2007.06099.x. Epub 2007 Oct 17. FEBS J. 2007. PMID: 17944942 Review.
-
The physiology of hyper-salinity tolerance in teleost fish: a review.J Comp Physiol B. 2012 Apr;182(3):321-9. doi: 10.1007/s00360-011-0624-9. Epub 2011 Oct 28. J Comp Physiol B. 2012. PMID: 22033744 Review.
Cited by
-
Functional Involvement of Carbonic Anhydrase in the Lysosomal Response to Cadmium Exposure in Mytilus galloprovincialis Digestive Gland.Front Physiol. 2018 Apr 4;9:319. doi: 10.3389/fphys.2018.00319. eCollection 2018. Front Physiol. 2018. PMID: 29670538 Free PMC article.
-
Molecular Characterization of a Dual Domain Carbonic Anhydrase From the Ctenidium of the Giant Clam, Tridacna squamosa, and Its Expression Levels After Light Exposure, Cellular Localization, and Possible Role in the Uptake of Exogenous Inorganic Carbon.Front Physiol. 2018 Mar 26;9:281. doi: 10.3389/fphys.2018.00281. eCollection 2018. Front Physiol. 2018. PMID: 29632495 Free PMC article.
-
The Complex Relationship between Metals and Carbonic Anhydrase: New Insights and Perspectives.Int J Mol Sci. 2016 Jan 19;17(1):127. doi: 10.3390/ijms17010127. Int J Mol Sci. 2016. PMID: 26797606 Free PMC article. Review.
-
Effects of salinity changes on aquatic organisms in a multiple stressor context.Philos Trans R Soc Lond B Biol Sci. 2018 Dec 3;374(1764):20180011. doi: 10.1098/rstb.2018.0011. Philos Trans R Soc Lond B Biol Sci. 2018. PMID: 30509913 Free PMC article. Review.
-
Molecular Plasticity under Ocean Warming: Proteomics and Fitness Data Provides Clues for a Better Understanding of the Thermal Tolerance in Fish.Front Physiol. 2017 Oct 23;8:825. doi: 10.3389/fphys.2017.00825. eCollection 2017. Front Physiol. 2017. PMID: 29109689 Free PMC article.
References
-
- Holmstrup M, Bindesbøl A, Oostingh GJ, Duschl A, Scheil V, et al. (2010) Interactions between effects of environmental chemicals and natural stressors: A review. Sci Total Environ 408: 3746–3762. - PubMed
-
- Lopes I, Baird D, Ribeiro R (2009) Resistance to metal contamination by hystorically-stressed populations of Ceriodaphnia pulchella: environmental influence versus genetic determination. Chemosphere 61: 1189–1197. - PubMed
-
- Løkke H (2010) Novel methods for integrated risk assesment of cumulative stressrs-results from the NoMiracle project. Total Environ 408: 3719–3724. - PubMed
Publication types
MeSH terms
Substances
LinkOut - more resources
Full Text Sources
Other Literature Sources
Miscellaneous

