. 2014 Oct 1;6(256):256ra134.
doi: 10.1126/scitranslmed.3009124.

Rhinovirus-induced IL-25 in asthma exacerbation drives type 2 immunity and allergic pulmonary inflammation

Affiliations

Rhinovirus-induced IL-25 in asthma exacerbation drives type 2 immunity and allergic pulmonary inflammation

Janine Beale et al. Sci Transl Med. .

Abstract

Rhinoviruses (RVs), which are the most common cause of virally induced asthma exacerbations, account for much of the burden of asthma in terms of morbidity, mortality, and associated cost. Interleukin-25 (IL-25) activates type 2-driven inflammation and is therefore potentially important in virally induced asthma exacerbations. To investigate this, we examined whether RV-induced IL-25 could contribute to asthma exacerbations. RV-infected cultured asthmatic bronchial epithelial cells exhibited a heightened intrinsic capacity for IL-25 expression, which correlated with donor atopic status. In vivo human IL-25 expression was greater in asthmatics at baseline and during experimental RV infection. In addition, in mice, RV infection induced IL-25 expression and augmented allergen-induced IL-25. Blockade of the IL-25 receptor reduced many RV-induced exacerbation-specific responses including type 2 cytokine expression, mucus production, and recruitment of eosinophils, neutrophils, basophils, and T and non-T type 2 cells. Therefore, asthmatic epithelial cells have an increased intrinsic capacity for expression of a pro-type 2 cytokine in response to a viral infection, and IL-25 is a key mediator of RV-induced exacerbations of pulmonary inflammation.


Figures

Figure 1
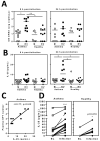
Figure 1. Asthmatics expressed greater levels of IL-25 in response to rhinovirus infection in vitro and in vivo
Cultured bronchial epithelial cells obtained from 10 asthmatic and 10 healthy volunteers were infected with RV-1B (RV) or mock infected (M). Quantification of IL-25 (A) mRNA and (B) secreted protein levels at 8 h and 24 h post-infection, as assessed by qRT-PCR and ELISA respectively. (C) Correlation of IL-25 protein levels at 24 h post-infection with the number of positive skin prick tests (SPT) in asthmatics. In another study, 28 asthmatic and 11 healthy human volunteers were experimentally infected with RV-16. (D) Baseline (BL) and peak IL-25 protein levels in the nasal mucosal fluid after RV-16 infection, quantified by MSD platform. Any value under 10 pg/mL was given a value of zero. *P<0.05 and **P<0.01 as indicated (A & B) and *P<0.05 and ***P<0.001 baseline vs infection peak (D). All data represent mean±s.e.m. qRT-PCR and ELISA data analysed by 1 away ANOVA with Bonferroni post-test. Baseline compared to peak infection IL-25 protein data were analysed by Wilcoxon Signed Rank test. Correlations were assessed with linear regression and Spearman’s coefficient (r) value.
Figure 2
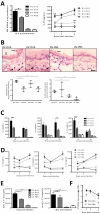
Figure 2. Rhinovirus infection increased pulmonary IL-25 expression which is associated with increased type-2 cytokine production, basophil recruitment and increased viral load in mice with allergic pulmonary inflammation
OVA-sensitized mice were challenged intranasally with OVA or PBS prior to infection with RV-1B (RV-OVA or RV-PBS) or UV-inactivated RV-1B (UV-OVA or UV-PBS) (n = 5 per group). (A) Quantification of IL-25 mRNA and protein levels in lung tissue at the indicated time points post-infection, as assessed by qRT-PCR and ELISA. (B) IL-25 protein expression in lung sections at day 2 post-infection, as assessed by immunohistochemistry. Black arrows indicate sub-epithelial IL-25+ inflammatory cells in OVA challenged mice. Open arrows indicate areas of IL-25+ epithelium in RV infected mice. Scale bar: 20 μm. Epithelial IL-25 staining intensity and number of IL-25+ inflammatory cells were measured and plotted. Immunohistochemistry data represent mean±s.e.m for three mice per treatment group. *P<0.05 (unpaired t-test) for RV-OVA vs indicated group. (C,D) Level of the type-2 cytokines IL-4, IL-5 and IL-13 protein levels in (C) BAL fluid and (D) lung homogenate by ELISA. (e) Total number of BAL and lung IL-4 expressing basophils at 1 day post-infection, as assessed by flow cytometry. (f) Viral RNA in lung tissue for RV infected mice, quantified by qRT-PCR. *P<0.05, **P<0.01 and ***P<0.001 for RV-OVA vs UV-OVA, ##P<0.01 for RV-PBS vs UV-PBS and ns = not significantELISA and qPCR results were analyzed by ANOVA and differences between groups identified using Bonferroni’s post-test
Figure 3
Figure 3. Rhinovirus-induced accumulation of IL-25-responsive cells in mice with allergic pulmonary inflammation
OVA-sensitized mice were challenged intranasally with OVA or PBS prior to infection with RV-1B (RV-OVA or RV-PBS) or UV-inactivated RV-1B (UV-OVA or UV-PBS) (n = 5 per group). (A) Representative flow plots of total IL-17RB+ leukocytes in lung and BAL and enumerated at day 1 and day 7. (B) IL-4-expressing IL-17RB+ CD4+ T cells at 1 and 7 days post-infection in lung and BAL measured by flow cytometry. *P<0.05, **P<0.01, ***P<0.001 and ns = not significant. All data anlayzed by ANOVA and differences between groups identified using Bonferroni’s post-test and represent mean±s.e.m and are representative of 2-3 studies.
Figure 4
Figure 4. Rhinovirus-induced accumulation of IL-25-responsive non-T type-2- cells in mice with allergic pulmonary inflammation
OVA-sensitized mice were challenged intranasally with OVA or PBS prior to infection with RV-1B (RV-OVA or RV-PBS) or UV-inactivated RV-1B (UV-OVA or UV-PBS) (n = 5 per group). (A, B) Representative flow cytometry plots and total BAL and lung numbers of (A) non-T/non-NK cells (from CD3, CD4 and DX5 gated cells) ICOS+/ST2+ cells and (B) IL-17RB+ non-T type 2 cells at 1 and 7 days post-infection. *P<0.05, **P<0.01, ***P<0.001 and ns = not significant. All data anlayzed by ANOVA and differences between groups identified using Bonferroni’s post-test and represent mean±s.e.m and are representative of 2-3 studies.
Figure 5
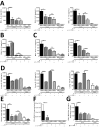
Figure 5. Blocking IL-25 signalling attenuated OVA-induced and rhinovirus-exacerbated expression of type-2 mediators in mice with allergic pulmonary inflammation
OVA-sensitized mice were challenged intranasally with OVA or PBS followed by intraperitoneal injection of anti-IL-17RB blocking antibody or isotype control (Ig) 4 h before and 3 and 5 days post-infection with RV-1B or UV inactivated RV-1B (n = 5 per group). (A) Type-2 cytokines IL-4, IL-5 and IL-13 at 8 post-infection (B) proinflammatory cytokine IL-6 at 8 h post-infection and (C) eosinophil recruiting chemokines CCL11 and CCL24 at 8 and 24 h post-infection respectively. (D) Type-2-associated epithelial-derived cytokines IL-25, IL-33 and TSLP in lung homogenate supernatant at 24 h post-infection. (E) Total serum IgE levels at 7 days post-infection by ELISA. (F) Viral RNA in lung homogenate at 10 h post-infection, as assessed by qRT-PCR. (G) MUC5ac protein in the BAL fluid at 7 days post-infection. All protein mediators in BAL and lung homogenate were assessed by ELISA. *P<0.05, **P<0.01, ***P<0.001 and ns = not significant. All data anlayzed by ANOVA and differences between groups identified using Bonferroni’s post-test and represent mean±s.e.m and are representative of 2-3 studies.
Figure 6
Figure 6. Blocking IL-25 signalling ablated rhinovirus-exacerbated type-2 leukocytic airways inflammation
OVA-sensitized mice were challenged intranasally with OVA or PBS followed by intraperitoneal injection of anti-IL-17RB blocking antibody or isotype control (Ig) 4 h before and 3 and 5 days post-infection with RV-1B or UV-RV-1B (n = 5 per group). (A) Total number of BAL neutrophils and eosinophils at day 1 post-infection and lymphocytes at day 7 post-infection, as assessed by differential cell counts. (B-D) Total numbers of BAL (B) IL-4+ basophils 1 day post-infection, (C) Non-T (from CD3, CD4 and DX5 gated cells) ICOS+/ST2+ cells at 8 h post-infection and (D) IL-4+ CD4+ T cells at 7 days post-infection, as assessed by flow cytometry. *P<0.05, **P<0.01 ***P<0.001 and ns = not significant. All data anlayzed by ANOVA and differences between groups identified using Bonferroni’s post-test represent mean±s.e.m. and are representative of 2-3 studies.

Comment in

References

    1. Johnston SL, Pattemore PK, Sanderson G, Smith S, Lampe F, Josephs L, Symington P, O’Toole S, Myint SH, Tyrrell DA, et al. Community study of role of viral infections in exacerbations of asthma in 9-11 year old children. Bmj. 1995;310:1225–1229. - PMC - PubMed
    1. Botturi K, Langelot M, Lair D, Pipet A, Pain M, Chesne J, Hassoun D, Lacoeuille Y, Cavailles A, Magnan A. Preventing asthma exacerbations: what are the targets? Pharmacol Ther. 2011;131:114–129. - PubMed
    1. Larche M, Robinson DS, Kay AB. The role of T lymphocytes in the pathogenesis of asthma. J Allergy Clin Immunol. 2003;111:450–463. quiz 464. - PubMed
    1. Christodoulopoulos P, Cameron L, Nakamura Y, Lemiere C, Muro S, Dugas M, Boulet LP, Laviolette M, Olivenstein R, Hamid Q. TH2 cytokine-associated transcription factors in atopic and nonatopic asthma: evidence for differential signal transducer and activator of transcription 6 expression. J Allergy Clin Immunol. 2001;107:586–591. - PubMed
    1. Berry MA, Parker D, Neale N, Woodman L, Morgan A, Monk P, Bradding P, Wardlaw AJ, Pavord ID, Brightling CE. Sputum and bronchial submucosal IL-13 expression in asthma and eosinophilic bronchitis. J Allergy Clin Immunol. 2004;114:1106–1109. - PubMed

Publication types

MeSH terms