

Infrared thermography detects febrile and behavioural responses to vaccination of weaned piglets
- PMID: 25274013
- PMCID: PMC4299536
- DOI: 10.1017/S1751731114002481
Infrared thermography detects febrile and behavioural responses to vaccination of weaned piglets
Abstract
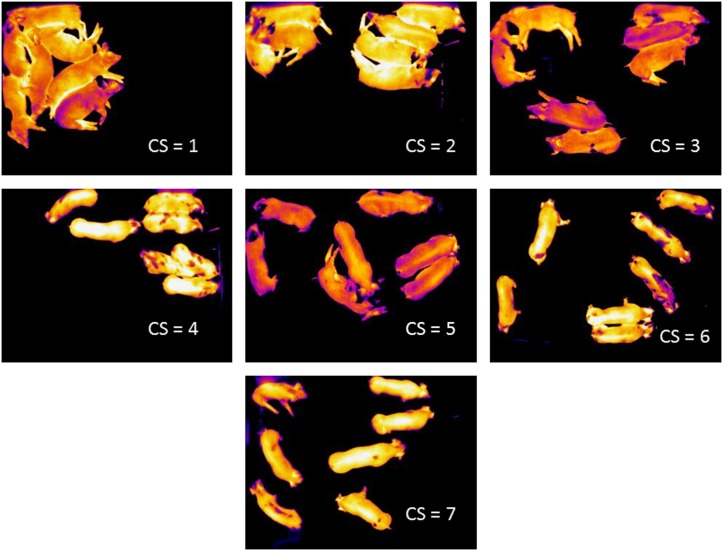
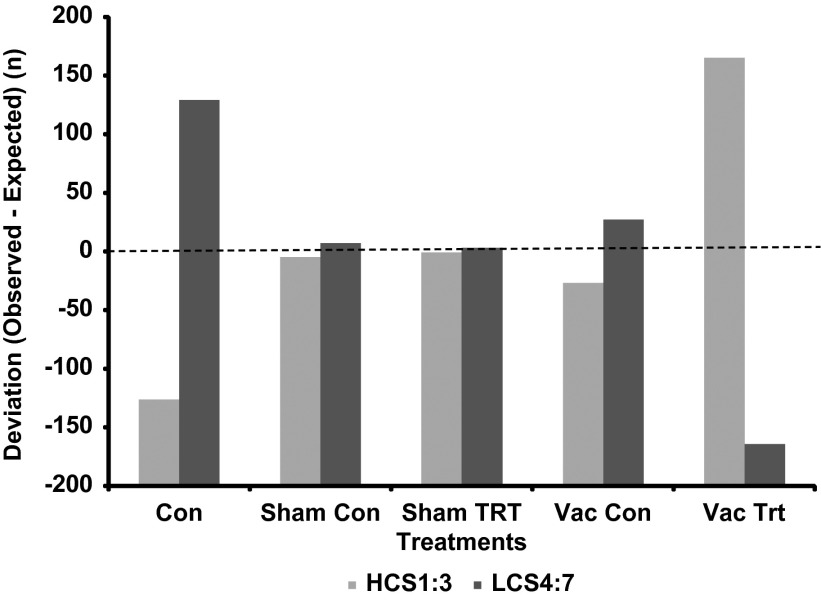
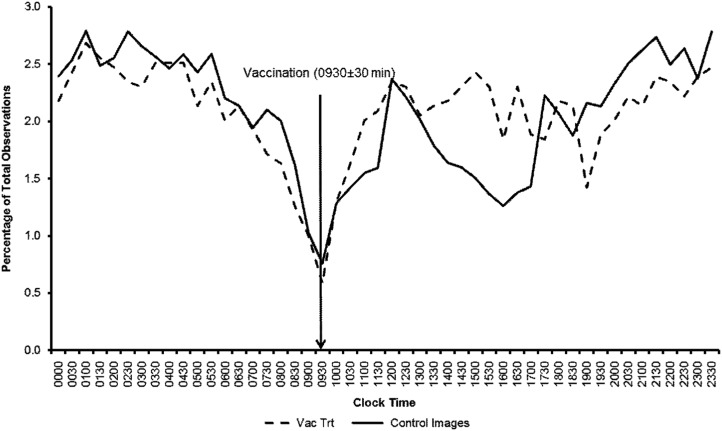
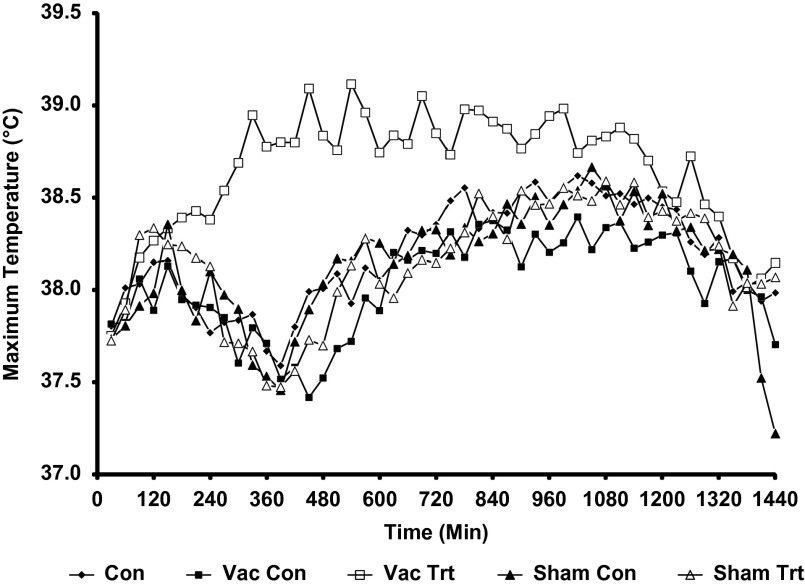
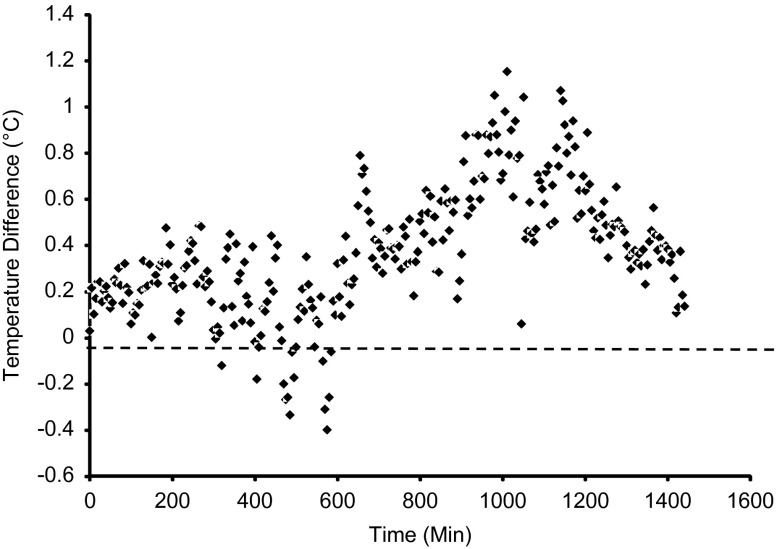
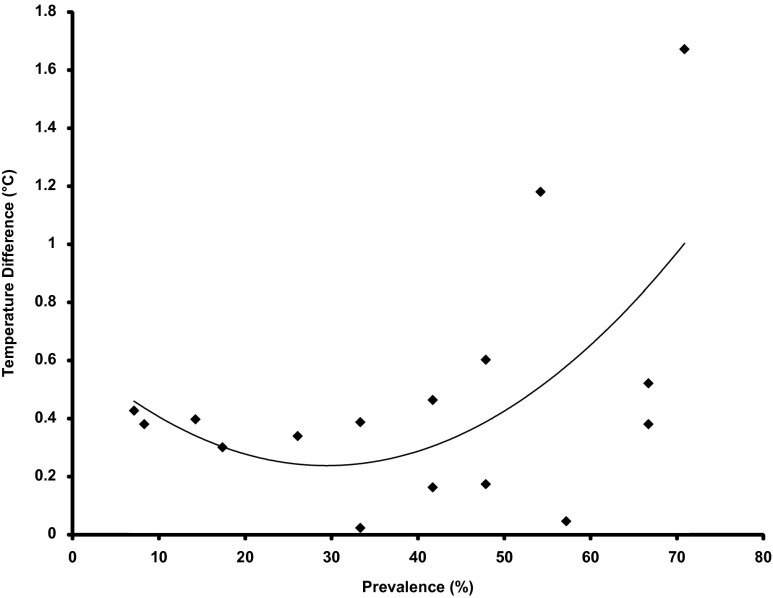
An automated, non-invasive system for monitoring of thermoregulation has the potential to mitigate swine diseases through earlier detection. Measurement of radiated temperature of groups of animals by infrared thermography (IRT) is an essential component of such a system. This study reports on the feasibility of monitoring the radiated temperature of groups of animals as a biomarker of immune response using vaccination as a model for febrile disease. In Study A, weaned pigs were either treated with an intramuscular vaccine (FarrowSure Gold), a sham injection of 0.9% saline or left as untreated controls. An infrared thermal camera (FLIR A320) was fixed to the ceiling directly above the pen of animals, and recorded infrared images of the treatment groups at 5 min intervals. The effect on temperature of the spatial distribution of pigs within the pen was significant, with higher temperatures recorded when pigs were grouped together into a single cluster. A higher frequency of clustering behaviour was observed in vaccinated animals compared with controls during a period of the afternoon ~4 to 7 h post-vaccination. The daily mean of the maximum image temperature was significantly higher in vaccinated animals compared with control and sham-treated animals. In the vaccination treated group, the 24 h mean of the maximum temperature was significantly higher during the post-vaccination period compared with the 24 h period before vaccination. Increased temperature in the vaccinated animals occurred from ~3 h, peaked at ~10 h, and remained elevated for up to 20 h post-vaccination. In Study B, the effect of prevalence was tested in terms of the difference in maximum temperature between control and vaccination days. A thermal response to vaccination was detected in a pen of 24 to 26 animals when <10% of the animals were vaccinated. The results support the concept of radiated temperature measurements of groups of animals by IRT as a screening tool for febrile diseases in pig barns.
Keywords: febrile response; infrared thermography; pigs; vaccination.
Figures
References
-
- Bitar D 2009. International travels and fever screening during epidemics: a literature review on the effectiveness and potential use of non-contact infrared thermometers. Eurosurveilance 14, 1–5. - PubMed
-
- Canadian Council on Animal Care in Science 2009. CCAC guidelines on: the care and use of farm animals in research, teaching and testing. Canadian Council on Animal Care, Ottawa, ON, Canada.
-
- Colak A, Polat B, Okumus Z, Kaya M, Yanmaz LE and Hayirli A 2008. Early detection of mastitis using infrared thermography in dairy cows. Journal of Dairy Science 91, 4244–4248. - PubMed
-
- Escobar J, van Alstine WG, Baker DH and Johnson RW 2007. Behaviour of pigs with viral and bacterial pneumonia. Applied Animal Behaviour Science 105, 42–50.
-
- Friendship R, Poljak Z and McIntosh K 2009. Use of infrared thermography for early detection of disease causing sudden death in a swine finishing barn.Proceedings of the 28th Annual Centralia Swine Research Update, 28th January 2009, Ontario, Canada, pp. I27-I28..
Publication types
MeSH terms
LinkOut - more resources
Full Text Sources
Medical
