. 2014 Dec;85(12):999-1010.
doi: 10.1002/cyto.a.22574. Epub 2014 Oct 1.

Expanding the potential of standard flow cytometry by extracting fluorescence lifetimes from cytometric pulse shifts

Affiliations
Free PMC article

Expanding the potential of standard flow cytometry by extracting fluorescence lifetimes from cytometric pulse shifts

Ruofan Cao et al. Cytometry A. 2014 Dec.
Free PMC article

Abstract

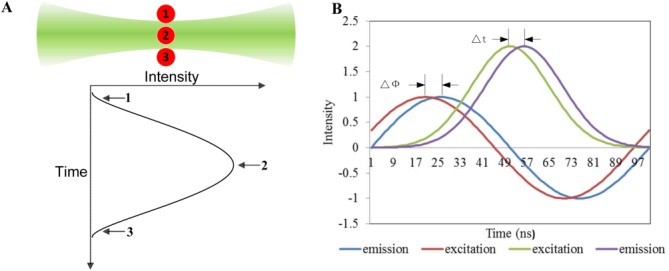
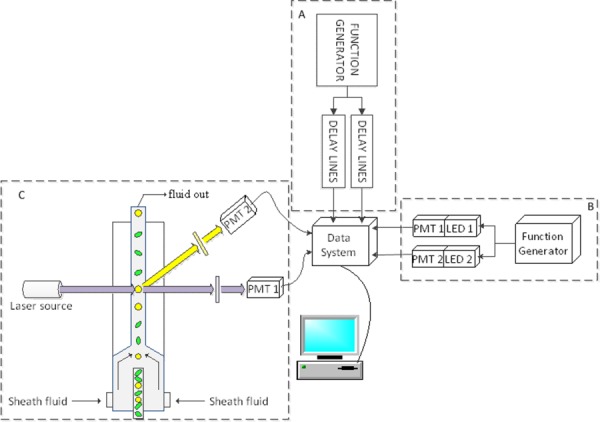
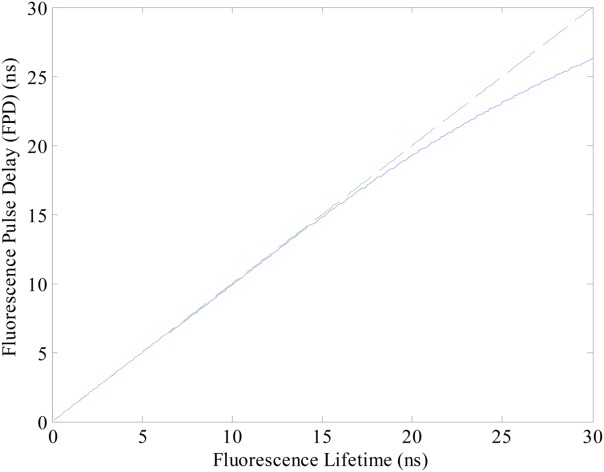
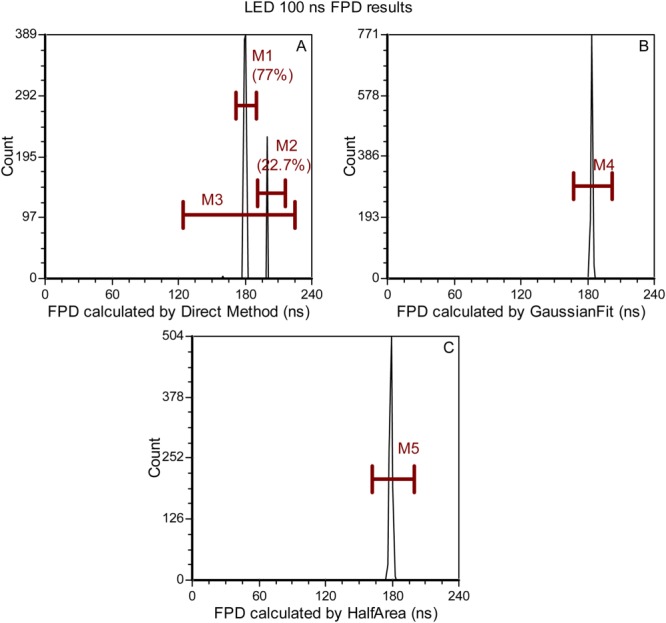
Fluorescence lifetime measurements provide information about the fluorescence relaxation, or intensity decay, of organic fluorophores, fluorescent proteins, and other inorganic molecules that fluoresce. The fluorescence lifetime is emerging in flow cytometry and is helpful in a variety of multiparametric, single cell measurements because it is not impacted by nonlinearity that can occur with fluorescence intensity measurements. Yet time-resolved cytometry systems rely on major hardware modifications making the methodology difficult to reproduce. The motivation of this work is, by taking advantage of the dynamic nature of flow cytometry sample detection and applying digital signal processing methods, to measure fluorescence lifetimes using an unmodified flow cytometer. We collect a new lifetime-dependent parameter, referred to herein as the fluorescence-pulse-delay (FPD), and prove it is a valid representation of the average fluorescence lifetime. To verify we generated cytometric pulses in simulation, with light emitting diode (LED) pulsation, and with true fluorescence measurements of cells and microspheres. Each pulse is digitized and used in algorithms to extract an average fluorescence lifetime inherent in the signal. A range of fluorescence lifetimes is measurable with this approach including standard organic fluorophore lifetimes (∼1 to 22 ns) as well as small, simulated shifts (0.1 ns) under standard conditions (reported herein). This contribution demonstrates how digital data acquisition and signal processing can reveal time-dependent information foreshadowing the exploitation of full waveform analysis for quantification of similar photo-physical events within single cells.

Keywords: digital signal processing; flow cytometry; fluorescence lifetime; fluorescence-pulse-delay.


Figures

Figure 1
Figure 1
Illustration showing the theory behind the nFLIC approach. A: Image depicting the transit of a fluorescently labeled microsphere (red circles) through a focused laser, and a Gaussian-like trace reflecting the resulting signal. The fluorescence emission begins to increase at position 1, peaks at position 2, and decreases as the microsphere moves from position 2 to position 3. B: Traces of sinusoidal waveforms demonstrating how the fluorescence lifetime can be measured using frequency-domain analysis as well as the nFLIC approach. The lag Δϕ in the emission signal (blue line) relative to the excitation signal (red line) is revealed in a phase shift that is proportional to the fluorescence lifetime [see Eq. 1]. Compared with the frequency-domain approach, only one “modulation cycle” is present using nFLIC. The purple trace indicates a time-delayed fluorescence signal, Δt, relative to the green line, a side or forward scatter signal. [Color figure can be viewed in the online issue, which is available at wileyonlinelibrary.com.]
Figure 2
Figure 2
A simple diagram of the nFLIC instrumentation. A: Gaussian-like waveforms are generated digitally using a function generator (Tektronix Inc., Beaverton, model AFG3120). Two waveforms are passed through separate delay lines (Allen Avionics Inc., Mineola) to introduce FPDs between the artificial signals. The waveforms are digitized at a sampling rate of 50 MSPS and input into two separate channels on the data system. A fire-wire connected computer is used for offline analysis using MATLAB (The MathWorks®). B: Identical LEDs are pulsed using a function generator (Tektronix Inc., Beaverton, model AFG3120). Each LED is pulsed at exact repetition rates; a delay between both is introduced. LED light output from each source is focused (diffusely) onto two separate but identical PMT (Hamamatsu, San Diego, Model R636-10) windows. No light attenuation was performed. C: A 488-nm OBIS™ laser (Coherent Inc.) at 150 mW excites microspheres driven by a pressurized fluidic system. The yellow and green colored circles and ovals represent injected microspheres, although for a given experiment only one type of microspheres was measured at a time. The laser was focused with two crossed cylindrical lenses onto the core of the flow stream. At 90-degrees fluorescence (PMT 1) and side scattering signals (PMT 2) are focused onto the side of two similar PMTs (Hamamatsu, San Diego, Model R928). Both signals are digitized and collected with the same 250 MSPS high-speed data acquisition system. After collection of the full waveforms by a fire-wire connected PC, MATLAB was used for offline analyses. [Color figure can be viewed in the online issue, which is available at wileyonlinelibrary.com.]
Figure 3
Figure 3
Relationship between fluorescence lifetime and FPD values for a 10 µs transit time. The solid line represents the FPD values calculated for a simulated range of fluorescence lifetimes. The dashed line represents a diagonal reference line passing through the origin with the slope of 1. The solid line will coincide with the dashed line if the FPD values perfectly predict the fluorescence lifetime. [Color figure can be viewed in the online issue, which is available at wileyonlinelibrary.com.]
Figure 4
Figure 4
Example results from the delay line experiments. In the three panels, A–C: different FPD values are compared for each signal processing approach implemented. The statistical values for each of these panels are shown in the Table1. For this example, the simulation results chosen were for a “transit time” of 2 µs and a simulated FPD of 3 ns, as measured by an oscilloscope (Tektronix, Fort Worth, TX, TDS 2004B). A: Histogram of the FPD values calculated using the direct method with red markers labeled M1, M2, and M3 placed on the histogram to indicate the statistical outcomes in the population after the FPD calculation. B: Histogram of FPD values calculated from the Gaussian regression method with a red marker labeled M4. C: Histogram of FPD values calculated from the half-area interpolation method with a red marker labeled M5. [Color figure can be viewed in the online issue, which is available at wileyonlinelibrary.com.]
Figure 5
Figure 5
x–y scatter plot of FPD estimates versus artificial delays (red lines are linear regression, black bars represent standard deviations). A–C present FPD values calculated from the direct, Gaussian-fitting, and half-area methods, respectively. Inset tables provide parameter results for each of the mathematic methods. [Color figure can be viewed in the online issue, which is available at wileyonlinelibrary.com.]
Figure 6
Figure 6
Example results from the hybrid-LED cytometry nFLIC experiments. In the four panels, A, B, and C different FPD values are compared for each signal processing approach implemented. Also, the statistical values for each of these panels are shown in the Table2. For this example, the simulation results chosen were for a transit time of 10 µs and a simulated FPD of 100 ns, as measured by an oscilloscope (Tektronix, Fort Worth, TX, TDS 2004B). A: Histogram of the FPD values calculated using the direct method with red markers labeled M1, M2, and M3 placed on the histogram to indicate the statistical outcomes in the population after the FPD calculation. B: Histogram of FPD values calculated from the Gaussian regression method with a red marker labeled M4. C: Histogram of FPD values calculated from the half-area interpolation method with a red marker labeled M5. [Color figure can be viewed in the online issue, which is available at wileyonlinelibrary.com.]
Figure 7
Figure 7
Evaluation of FPD value measurements by direct, Gaussian-fitting and half-area methods for LED experiments. A–C present FPD values calculated from the direct, Gaussian-fitting, and half-area methods, respectively. The red lines are the linear function best fit to the mean of PFD values for different calculated FPD values. Black bars represent the standard deviation for each of the delay experiments. Tables in each panel provide fitting parameters for each method. [Color figure can be viewed in the online issue, which is available at wileyonlinelibrary.com.]
Figure 8
Figure 8
Histograms of FPD values for fluorescein, PE and PI microsphere data using the Gaussian-fitting (A) and half-area (B) methods. Three markers (M1, M2, and M3) were used to calculate the mean FPD values and other statistical parameters. [Color figure can be viewed in the online issue, which is available at wileyonlinelibrary.com.]

References

    1. Lakowicz JR. Principles of Fluorescence Spectroscopy. New York: Springer; 2009.
    1. Sailer BL, Nastasi AJ, Valdez JG, Steinkamp JA, Crissman HA. Interactions of intercalating fluorochromes with DNA analyzed by conventional and fluorescence lifetime flow cytometry utilizing deuterium oxide. Cytometry. 1996;25:164–172. - PubMed
    1. Chen Y, Periasamy A. Characterization of two-photon excitation fluorescence lifetime imaging microscopy for protein localization. Microsc Res Tech. 2004;63:72–80. - PubMed
    1. Ziomkiewicz I, Loman A, Klement R, Fritsch C, Klymchenko AS, Bunt G, Jovin TM, Arndt-Jovin DJ. Dynamic conformational transitions of the EGF receptor in living mammalian cells determined by FRET and fluorescence lifetime imaging microscopy. Cytometry Part A J Int Soc Anal Cytol. 2013;83A:794–805. - PubMed
    1. Leavesley SJ, Britain AL, Cichon LK, Nikolaev VO, Rich TC. Assessing FRET using spectral techniques. Cytometry Part A J Int Soc Anal Cytol. 2013;83A:898–912. - PMC - PubMed

Publication types