. 2014 Oct 23;514(7523):450-4.
doi: 10.1038/nature13807. Epub 2014 Oct 1.

Pulmonary macrophage transplantation therapy

Affiliations

Pulmonary macrophage transplantation therapy

Takuji Suzuki et al. Nature. .

Abstract

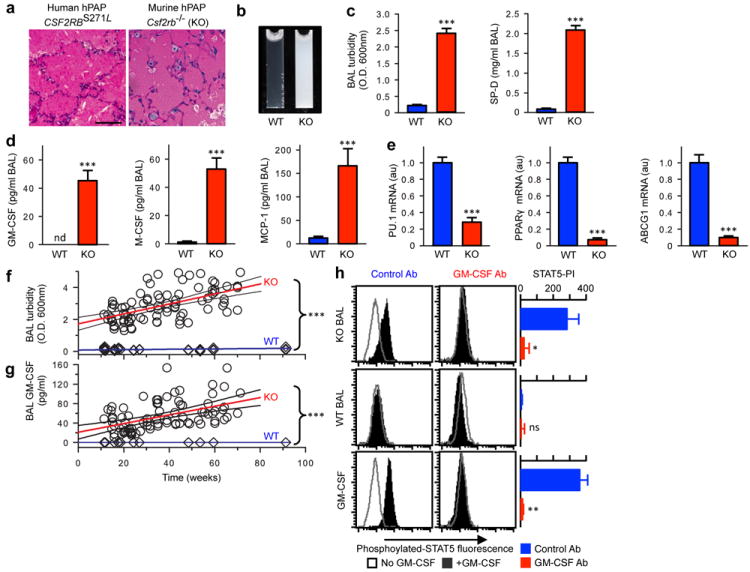
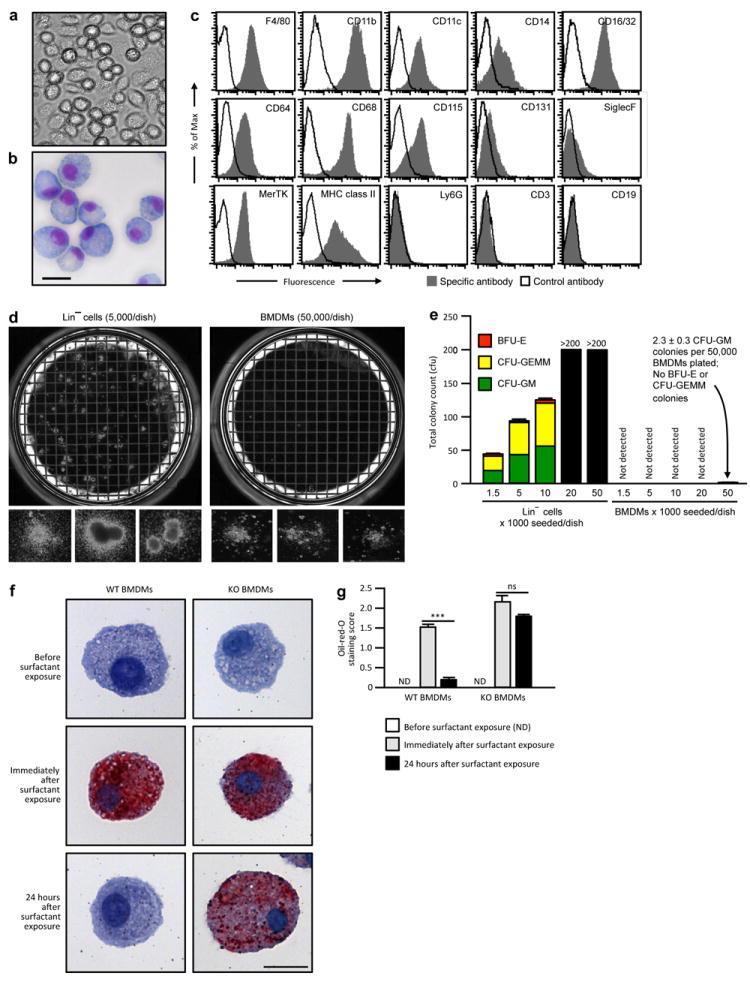
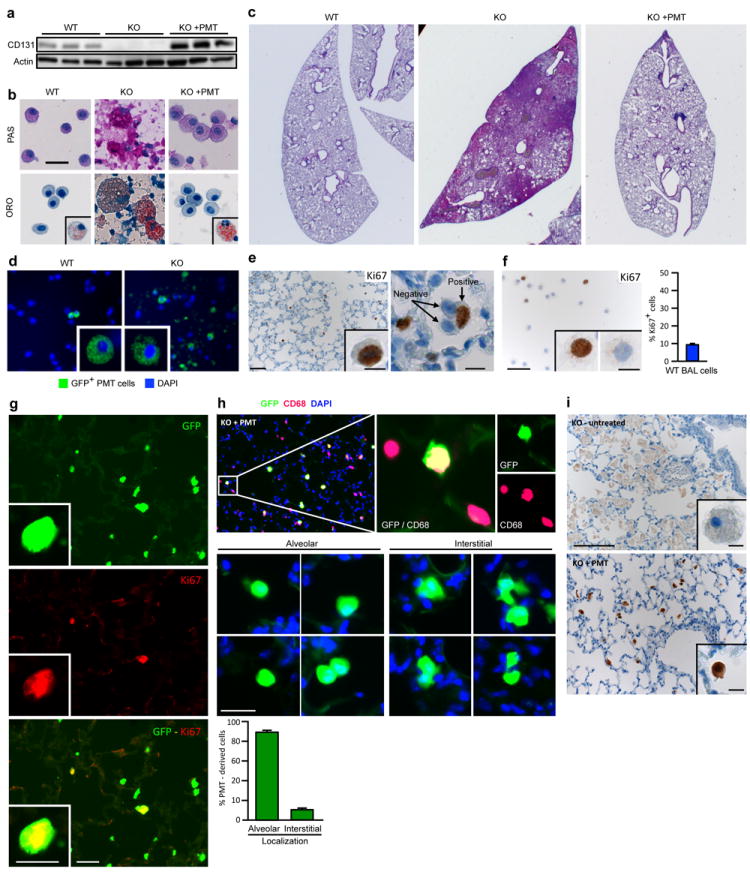
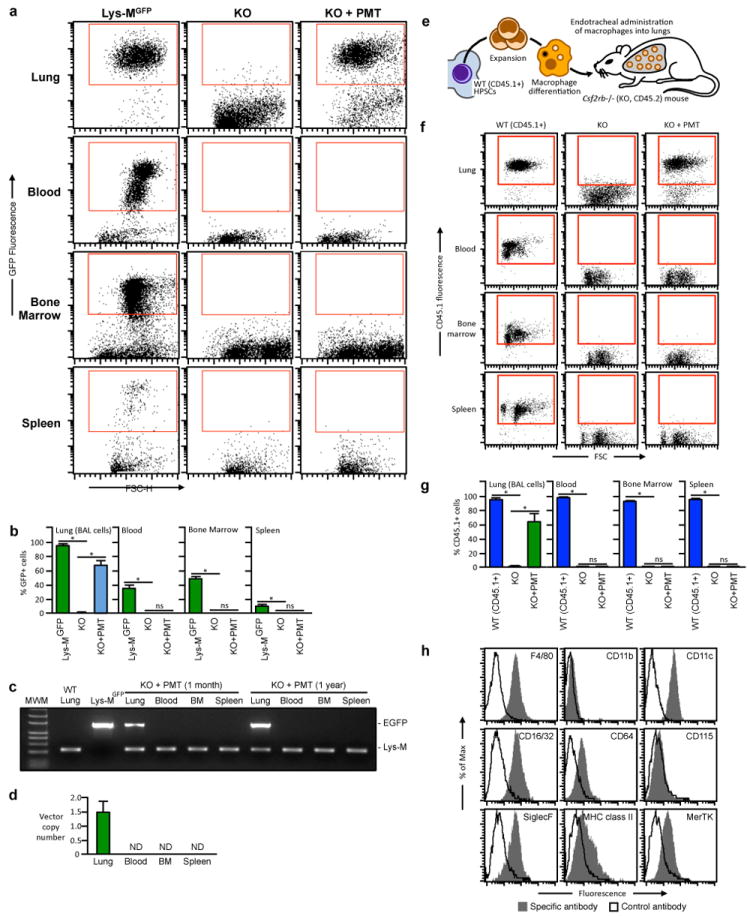
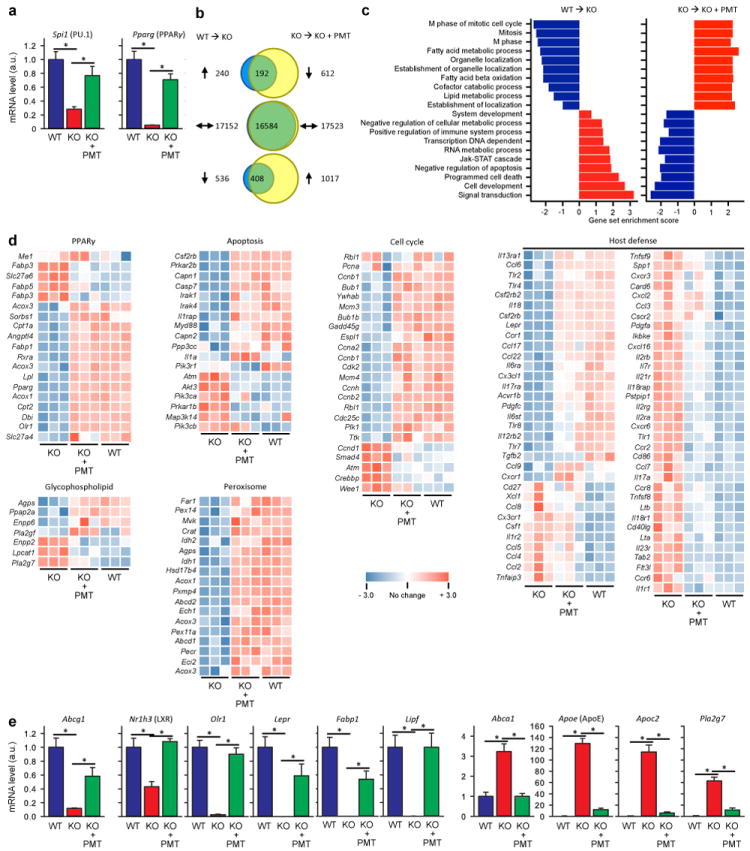
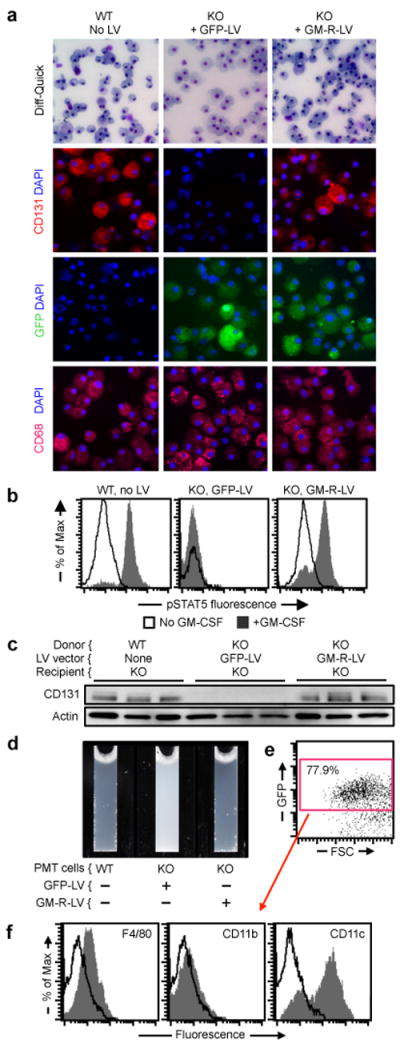
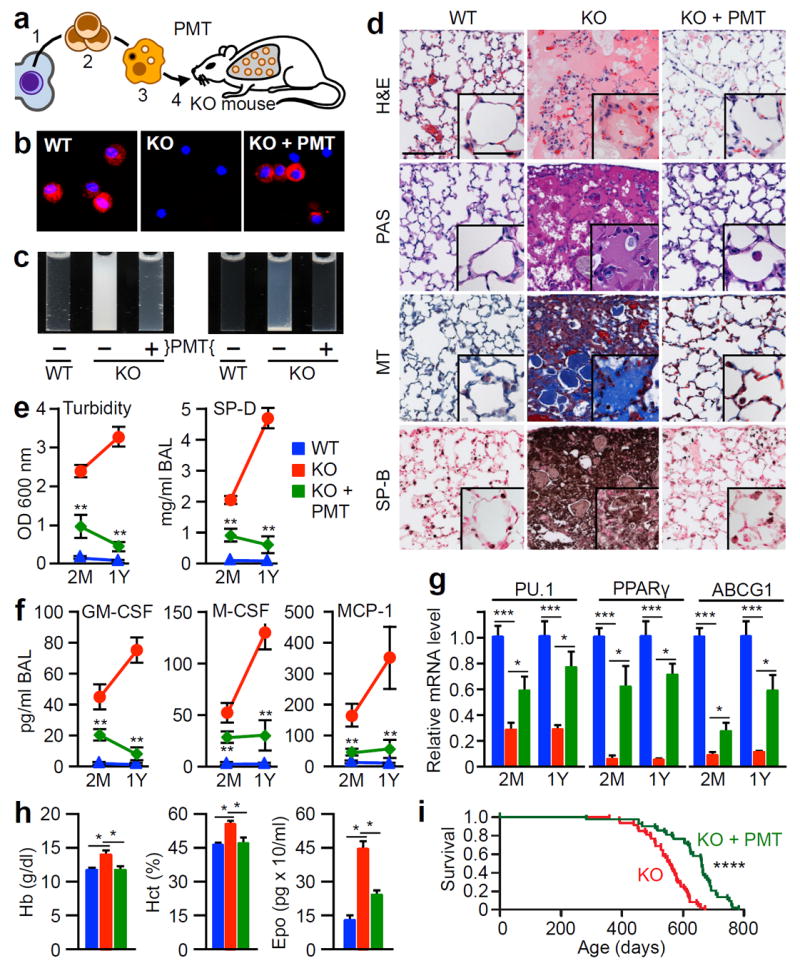
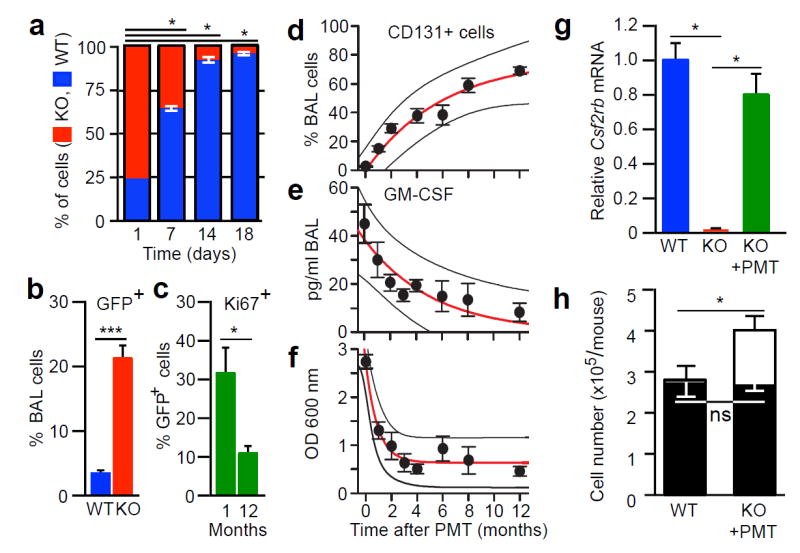
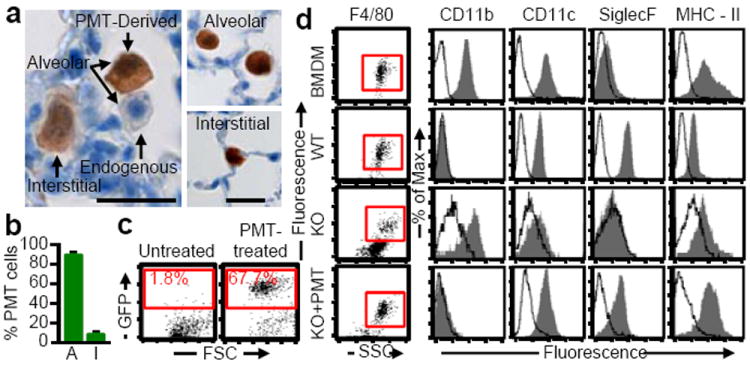
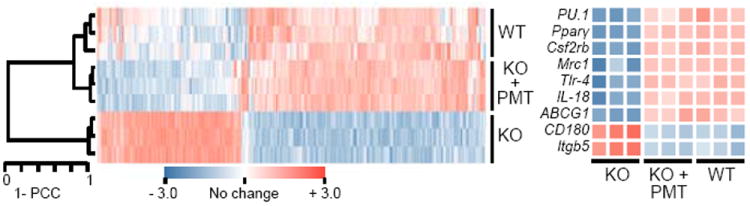
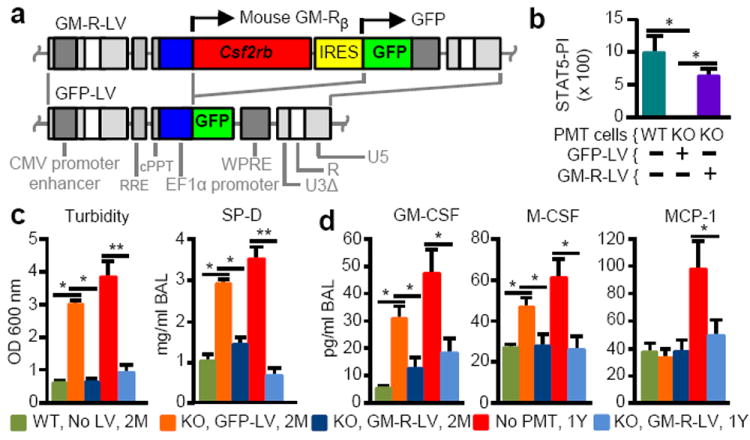
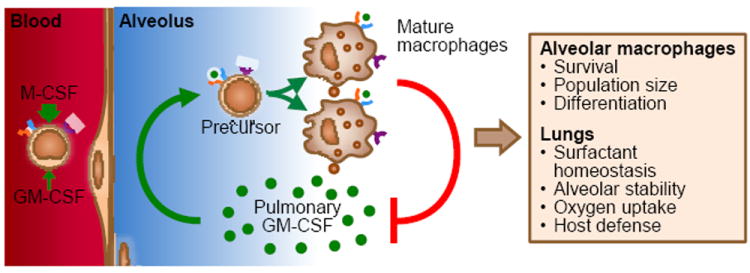
Bone-marrow transplantation is an effective cell therapy but requires myeloablation, which increases infection risk and mortality. Recent lineage-tracing studies documenting that resident macrophage populations self-maintain independently of haematological progenitors prompted us to consider organ-targeted, cell-specific therapy. Here, using granulocyte-macrophage colony-stimulating factor (GM-CSF) receptor-β-deficient (Csf2rb(-/-)) mice that develop a myeloid cell disorder identical to hereditary pulmonary alveolar proteinosis (hPAP) in children with CSF2RA or CSF2RB mutations, we show that pulmonary macrophage transplantation (PMT) of either wild-type or Csf2rb-gene-corrected macrophages without myeloablation was safe and well-tolerated and that one administration corrected the lung disease, secondary systemic manifestations and normalized disease-related biomarkers, and prevented disease-specific mortality. PMT-derived alveolar macrophages persisted for at least one year as did therapeutic effects. Our findings identify mechanisms regulating alveolar macrophage population size in health and disease, indicate that GM-CSF is required for phenotypic determination of alveolar macrophages, and support translation of PMT as the first specific therapy for children with hPAP.


Conflict of interest statement

The authors declare no competing financial interests.

Figures

Extended Data Figure 1
Extended Data Figure 1. Validation of Csf2rb-/- (KO) mice as an authentic model of human hPAP
(a) Typical lung pathology showing surfactant-filled alveoli with well-preserved septa in a child homozygous for CSF2RBS271L mutations and identical pulmonary histopathology in a KO mouse. PAS stain. Scale bar, 100 μm. (b) Photographs of ‘milky’-appearing BAL from a 14 month-old KO mouse and normal-appearing BAL from an age-matched WT mouse (representative of n=6 mice/group). (c) Increased BAL turbidity and SP-D concentration in 4 month-old mice KO compared to age-matched WT mice. (d) BAL fluid biomarkers of hPAP (GM-CSF, M-CSF, and MCP-1) are reduced in 4 month-old KO mice compared to age-matched WT mice. (e) Alveolar macrophage biomarkers (PU.1, Pparg, Abcg1 mRNA) are reduced in 4 month-old KO compared to age-matched WT mice. (f) Progressive increase in BAL turbidity in KO mice but not age-matched WT mice (linear regression: KO, slope = 0.1271 ± 0.16 (r2, 0.311); WT, slope =0.031± 0.005). (g) Progressive increase in BAL fluid GM-CSF level in KO mice but not age-matched WT mice (linear regression: KO, slope =0.89±0.016 (r2, 0.249); WT, slope =0). Data are mean ± SEM of n=7 mice/group (c-j) or symbols representing individual WT (n=38) or KO (n=84) mice and the regression fit ± 95% CI lines. (h) GM-CSF bioactivity in BAL fluid from 10 month-old KO or WT mice (or 1 ng/ml murine GM-CSF) measured in the presence of anti-GM-CSF antibody (GM-CSF Ab) or isotype control (Control Ab) using the GM-CSF-stimulated STAT5 phosphorylation index (STAT5-PI) assay. Data are mean ± SEM of n=7 mice/group (c-e), n=4 (h) or symbols representing individual WT (n=38) or KO (n-84) mice and regression fit ± 95% CI (f-g). *p < 0.05, ***P<0.001, not significant (ns).
Extended Data Figure 2
Extended Data Figure 2. Characterization of BMDMs before PMT
(a-b) Photomicrographs of WT BMDMs prior to transplantation phase-contrast (a) or Diff-Quick staining (b) (Representative of n=7 BMDM preparations). Scale bar, 20 μm. (c) Flow cytometry evaluation of cell-surface phenotypic markerson WT BMDMs before PMT. (d) Photographs of methylcellulose cultures of Lin cells (5,000/dish) from bone marrow (left) and BMDMs (50,000/dish) prepared as described in the Methods (right) and typical colonies (below) (representative n=3 per condition). (e) Colony counts of BFU-E, CFU-GEMM and CFU-GM showing BMDMs contained <0.005% CFU-GM and no BFU-E or CFU-GEMM progenitors, corresponding to 93 CFU-GM per dose of BMDMs administered (n=3 determinations per condition). (f-g) Evaluation of surfactant clearance capacity. Representative photomicrographs of BMDMs from WT (left) or KO (right) were examined before (top) or immediately after incubation with surfactant for 24 hours (middle), or after exposure, removal of extracellular surfactant and culture for 24 hours in the absence of surfactant (lower) after oil-red-O staining (Representative of n=3 per condition). Scale bar, 20 μm. (g) Measurement of surfactant clearance by BMDMs after exposure as just described (Panel f) and quantified using a visual grading scale (the oil-red-O staining index) to measure the degree of staining. Bars represent the mean ± SEM (n=3/condition) of oil-red-O staining score for 10 high-power fields for each group. Not detected (ND).***P<0.001.
Extended Data Figure 3
Extended Data Figure 3. Efficacy of PMT in KO mice and characterization of macrophages after PMT
(a) Detection of CD131 (top) or actin (bottom) in BAL cells by western blotting one year after PMT (each lane represents one mouse of 6/group). (b) Representative cytology of BAL obtained one year after PMT after staining with PAS or oil-red-O (ORO) (6 mice/group). Scale bar, 25 μm. Oil-red-O positive cells were seen rarely in WT mice and occasionally in PMT-treated KO mice (insets). Cytological abnormalities in BAL from untreated KO mice including large, ‘foamy’, PAS- and oil-red-O-stained alveolar macrophages and PAS-stained cellular debris, were corrected by PMT. (c) Representative photomicrographs of PAS-stained whole-mount lung sections one year after PMT. Note that some residual disease remained at one year. (1×). (d) GFP+ cells in BAL cells from WT or KO mice 2 months after PMT of Lys-MGFP BMDMs. (e) Macrophage replication after PMT. KO mice received Lys-MGFP BMDMs by PMT and paraffin-embedded lung was immunostained for Ki67 one month or one year later. Scale bar, 50 μm; inset, 10μm. (f) Ki67 staining of BAL cells from an untreated WT mice (e). Inset shows positive (left) or negative (right) staining. Scale bar, 50 μm; inset 10 μm. Graph shows the percent Ki67+ BAL cells in age-matched WT mice (n = 5). (g) Representative immunofluorescence photomicrographs of frozen lung sections one year after PMT of Lys-MGFP into KO mice identifying GFP+ cells (top), Ki67+ cells (middle), and GFP+ Ki67+ (replicating, PMT-derived) cells (bottom). Scale bar, 20 μm; inset scale bar, 10μm. Quantitative summary data are shown in the manuscript (Fig. 2c). (h) Localization of macrophages within the lungs one year after PMT of Lys-MGFP BMDMs into KO mice and visualization in frozen lung sections after CD68 immunostaining, DAPI counter staining, and fluorescence microscopy to detect CD68+/GFP+ cells (i.e., PMT-derived macrophages) or CD68+/GFP cells (i.e., non-PMT-derived endogenous macrophages). Graph shows quantitative data for n=6 mice. (i) Localization of macrophages in these same mice (Panel h) by detecting GFP by immunohistochemical staining of paraffin-embedded lung sections using light microscopy to eliminate potential interference from autofluorescence. Quantitative summary data are shown in the manuscript (Fig. 3b).
Extended Data Figure 4
Extended Data Figure 4. Tissue distribution and characterization of transplanted cells one year after PMT
(a-d) Two month-old KO mice (4/group) received one PMT of Lys-MGFP BMDMs. Twelve months later, untreated, age-matched WT Lys-MGFP or KO mice and PMT-treated KO mice were evaluated using flow cytometry to detect GFP+ cells in the indicated organs. Representative data (a) and the percentage of GFP+ cells in the gated region are shown (b). Similar results were observed in KO mice two months after PMT of Lys-MGFP BMDMs (not shown). (c) Detection of Lys-MGFP PMT cells by PCR. PCR of genomic DNA from BAL cells (Lung), white blood cells (Blood), bone marrow (BM) cells and splenocytes (Spleen) of 1 month or 1 year after Lys-MGFP BMDMs PMT were performed to detect EGFP and Lysozyme M gene. BAL cells (Lung) from WT and Lys-MGFP were shown as negative and positive control for EGFP. EGFP was only detected in lung. (d) Vector copy number analysis after gene-corrected BMDMs PMT. Quantitative PCR with vector-specific primers (R-U5) was performed using genomic DNA from BAL cells (Lung), white blood cells (Blood), bone marrow (BM) cells and splenocytes (Spleen) obtained 1 year after PMT of gene-corrected macrophages. Note that the viral vector was only detected in lung. (e-h) CD45.2+ KO mice received one PMT of CD45.1+ BMDMs from congenic WT mice (e) and one year later, untreated, age-matched WT (CD45.1+) or KO (CD45.2+) mice and PMT-treated KO mice were evaluated by flow cytometry to detect CD45.1+ cells in the indicated organs. Representative data (f) and the percentage of CD45.1+cells in the gated regions are shown (g). Phenotypic characterization of PMT-derived (CD45.1+) cells (as shown in the gated region (f)). Results are similar to those for PMT of Lys-MGFP BMDMs (Fig 3d). Numeric data are mean ± SEM of n=4mice/group (a, d). Not detected (ND).*p < 0.05. Not significant (ns).
Extended Data Figure 5
Extended Data Figure 5. Global gene expression analysis of alveolar macrophages from age-matched WT, KO, and KO mice one year after PMT of WT BMDMs
(a) Expression of Spi1 (PU.1) and Pparg (PPARγ) were confirmed by qRT-PCR using independent samples (6 mice/group). (b) Venn diagrams showing numbers of genes whose expression was altered in alveolar macrophages from KO compared to WT mice (WT→KO) or PMT-treated compared to untreated KO mice (KO→KO+PMT). Only genes with statistically significant changes (false detection rate < 10%) of at least two-fold were marked as increased (up arrows) or decreased (down arrows). The numbers of genes for which expression was disrupted in KO mice and normalized by PMT (or unchanged in both comparisons) is shown in the overlap regions. (c) Gene ontology analysis identifying pathways disrupted in KO mice and restored by PMT. Data show the coordinate increases (red) or decreases (blue) in expression of genes in all gene sets significant at or below a false detection rate of 10% calculated by the Gene Set Test with correction for multiple testing. (d) Heat maps showing differentially expressed genes in multiple KEGG pathways including PPARγ-regulated genes, glycophospholipid metabolism, peroxisome function apoptosis, cell cycle control, and immune host defense. Genes with increased or decreased transcript levels are shown by red and blue colors, respectively. (e) Confirmation by qRT-PCR for selected genes important in lipid metabolism. Data are mean ± SEM using independent samples (6 mice/group). *p < 0.05.
Extended Data Figure 6
Effects of PMT of gene-corrected macrophages on hPAP. (a) Macrophages derived from KO LSK cells transduced with GM-R-LV or GFP-LV, or from non-transduced WT LSK cells (indicated) were examined by light microscopy after Diff-Quick staining (top), or by immunofluorescence microscopy after staining with anti-CD131 (GM-CSF-R-β) and DAPI (upper middle), DAPI alone (lower middle), or anti-CD68 and DAPI (bottom). Images are representative of 3 experiments per condition. (b) Evaluation of GM-CSF receptor signaling in the indicated cells (before PMT) by measurement of GM-CSF-stimulated STAT5 phosphorylation by flow cytometry. Representative of n=3 experiments per condition. Quantitative summary data are shown in the manuscript (Fig. 5b). (c) Western blotting to detect GM-CSF receptor-β (CD131) (top) or actin (bottom, as a loading control) in BAL cells from age-matched KO mice 2 months after PMT as indicated (each lane represents one mouse of n=10, 8, 10/group, respectively). (d) Appearance of BAL from age-matched KO mice 2 months after PMT as indicated (representative of n=10, 8, 10/group, respectively). (e-f) One year after PMT of GM-R-LV transduced KO LSK cell-derived macrophages in KO mice, GFP+ cells were identified (e) and evaluated for cell surface markers by flow cytometry (f) (representative of n=7 mice).
Figure 1
Figure 1
Therapeutic efficacy of PMT in Csf2rb−/− (KO) mice. (a) Schematic of the method used. WT HSPCs (1) were isolated, expanded (2), differentiated into macrophages (3), and administered by endotracheal instillation into 2 month-old KO mice (4) and evaluated after two months (2M) (e-g) or one year (1Y) (b-h) with age-matched, untreated WT or KO mice (KO+PMT, WT or KO, respectively). (b) CD131-immunostained BAL cells.(c) Appearance of BAL fluid (left) or sediment (right). (d) Lung histology after staining with H&E, PAS, Masson’s trichrome (MT), or surfactant protein B (SP-B). Scale bar, 100μm; inset, 50μm. (e) BAL turbidity and SP-D concentration. (f) BAL biomarkers. (g) Alveolar macrophage biomarkers. (h) Effects of PMT on blood hemoglobin (Hb), hematocrit (Hct), serum erythropoietin (Epo). (i) Kaplan-Meier analysis of PMT-treated (n=43) and untreated KO mice (n=48). Images are representative of 6 mice/group (b-d). Numeric data are Mean ± SEM of 7 (2M) or 6 (1Y) mice/group. *p<0.05, **p<0.01, ***p<0.001, ****p<0.0001.
Figure 2
Figure 2
Pharmacokinetics and pharmacodynamics of PMT in KO mice. (a) Competitive proliferation of WT and KO BMDMs co-cultured with GM-CSF and M-CSF (n=3 plates/point). (b) Quantification of GFP+ BAL cells 2 months after PMT of Lys-MGFP BMDMs into WT (n=3) or KO (n=6) mice. (c) Quantitation of Ki67+ Lys-MGFP cells in KO mice (n=3) one or twelve months after PMT. (d-f) KO mice received PMT of WT BMDMs and were evaluated at the indicated times to quantify CD131+BAL cells (d), BAL GM-CSF concentration (e), and BAL turbidity (f). Exponential regression (± prediction bands), R2=0.943 (d), R2=0.819 (e), R2=0.958 (f). Data are mean ± SEM for 3-7 mice/group. (g) Csf2rb mRNA in BAL cells from KO mice one year after PMT, or untreated, age-matched control mice (n=6). (h) Number of BAL cells (open bars) or CD131+ alveolar macrophages (closed bars) in KO mice one year after PMT (n = 5) or untreated WT mice (n=10). Data are mean ± SEM. *p < 0.05, ***P<0.001, not significant (ns).
Figure 3
Figure 3
Localization and phenotype of transplanted macrophages. Lys-MGFP BMDMs were transplanted into KO mice and evaluated after one year. (a) Immunostained lung showing GFP+ cells (Scale bar, 200 μm; inset, 20 μm). (b) Localization of GFP+ macrophages to intra-alveolar (A) and interstitial (I) spaces (n=6). (c) GFP+ BAL cells identified by flow cytometry. (d) Phenotypic analysis of F4/80+ BMDMs before PMT, and alveolar macrophages from PMT-treated KO mice, or untreated, age-matched WT or KO mice (n=6/group). Data are mean±SEM.
Figure 4
Figure 4
Microarray analysis of alveolar macrophages one year after PMT. Unsupervised hierarchical clustering dendrogram and heat-map of selected GM-CSF-regulated genes in PMT-treated KO mice or untreated, age-matched WT or KO mice (3/group). Pearson correlation coefficient (PCC).
Figure 5
Figure 5
Effects of PMT of gene-corrected macrophages on hPAP severity and biomarkers. KO mice received PMT of non-transduced WT or LV-transduced KO macrophages and were evaluated after two month (2M) or one year (1Y) (with untreated, age-matched KO mice). Key indicates PMT cells used, prior LV treatment, and time after PMT analysis was performed. (a) LV schematics. (b) GM-CSF signaling measured by the STAT5 phosphorylation index (STAT5-PI) in the indicated cells before PMT. (c) BAL turbidity and SP-D concentration. (d) BAL biomarkers. Mean ± SEM of n=3 (b) or 5-10 (c-g) mice/group. *p < 0.05, **p < 0.01.
Figure 6
Figure 6
Proposed homeostatic reciprocal feedback mechanism by which pulmonary GM-CSF regulates alveolar macrophage population size in vivo.

Comment in

Similar articles

Cited by

References

    1. Suzuki T, et al. Familial pulmonary alveolar proteinosis caused by mutations in CSF2RA. The Journal of experimental medicine. 2008;205:2703–2710. - PMC - PubMed
    1. Martinez-Moczygemba M, et al. Pulmonary alveolar proteinosis caused by deletion of the GM-CSFR alpha gene in the X chromosome pseudoautosomal region 1. The Journal of experimental medicine. 2008;205:2711–2716. - PMC - PubMed
    1. Suzuki T, et al. Hereditary pulmonary alveolar proteinosis: pathogenesis, presentation, diagnosis, and therapy. American journal of respiratory and critical care medicine. 2010;182:1292–1304. - PMC - PubMed
    1. Tanaka T, et al. Adult-onset hereditary pulmonary alveolar proteinosis caused by a single-base deletion in CSF2RB. J Med Genet. 2011;48:205–209. - PubMed
    1. Suzuki T, et al. Hereditary pulmonary alveolar proteinosis caused by recessive CSF2RB mutations. The European respiratory journal. 2011;37:201–204. - PubMed

Publication types

MeSH terms

Substances

Associated data