. 2014 Oct 1;34(40):13349-63.
doi: 10.1523/JNEUROSCI.0972-14.2014.

Plasticity in developing brain: active auditory exposure impacts prelinguistic acoustic mapping

Affiliations

Plasticity in developing brain: active auditory exposure impacts prelinguistic acoustic mapping

April A Benasich et al. J Neurosci. .

Abstract

A major task across infancy is the creation and tuning of the acoustic maps that allow efficient native language processing. This process crucially depends on ongoing neural plasticity and keen sensitivity to environmental cues. Development of sensory mapping has been widely studied in animal models, demonstrating that cortical representations of the sensory environment are continuously modified by experience. One critical period for optimizing human language mapping is early in the first year; however, the neural processes involved and the influence of passive compared with active experience are as yet incompletely understood. Here we demonstrate that, while both active and passive acoustic experience from 4 to 7 months of age, using temporally modulated nonspeech stimuli, impacts acoustic mapping, active experience confers a significant advantage. Using event-related potentials (ERPs), we show that active experience increases perceptual vigilance/attention to environmental acoustic stimuli (e.g., larger and faster P2 peaks) when compared with passive experience or maturation alone. Faster latencies are also seen for the change discrimination peak (N2*) that has been shown to be a robust infant predictor of later language through age 4 years. Sharpening is evident for both trained and untrained stimuli over and above that seen for maturation alone. Effects were also seen on ERP morphology for the active experience group with development of more complex waveforms more often seen in typically developing 12- to 24-month-old children. The promise of selectively "fine-tuning" acoustic mapping as it emerges has far-reaching implications for the amelioration and/or prevention of developmental language disorders.

Keywords: EEG/ERP; acoustic mapping; developmental plasticity; human infant; prelinguistic; training.


Figures

Figure 1.
Figure 1.
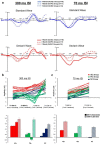
Overall study design and grand average waveforms depicting maturational effects from 4 to 7 months of age. a, Schematic of overall study design. b, Grand average waveforms from 124 electrodes at Fz at the initial 4 month visit (before auditory exposure) for the AEx and PEx groups, and for both 4 month groups combined. Stimuli were complex tone pairs; each tone was 70 ms in duration with either a 300 or 70 ms within-pair ISI, presented in a standard blocked design. Standard (blue) and deviant (red) waves are shown for the control (300 ms ISI) and fast-rate (70 ms ISI) conditions. No significant differences emerged between the AEx (dotted line) and PEx (dashed line) groups; thus, all the 4-month-old pre-exposure infants (solid line) combined served as the control group for the cross-sectional maturation analyses. c, Grand average waveforms from 124 electrodes at Fz, for the 300 and 70 ms ISI conditions for the 4 month combined pre-exposure group and the 7 month NC group. Standard waves are in blue, and deviant waves are in red. Maturational effects were seen on morphology, amplitude, and latency as a function of age for both conditions on both standard and deviant waves at all (frontal, frontocentral, and central) channels. At 300 ms ISI, significantly faster latencies for the 7 month group compared with the younger infants are seen for the P1 and P2 peaks as well as significantly larger amplitudes on the standard and deviant waves. Similarly, at 70 ms ISI the P1 on the standard waves and the P1 and P2 on the deviant waves in 7-month-old children were significantly faster and smaller in amplitude than those in 4-month-old children. Negative peak amplitudes increased from 4 to 7 months.
Figure 2.
Figure 2.
Group effects of auditory exposure on latency and amplitude for all three groups at the 7 month post-test. a, Grand average waveforms from 124 electrodes overlaid for AEx (solid line), PEx (dashed line), and NC (dotted line) groups at Fz. Standard (blue) and deviant (red) waves are shown for the control (300 ms ISI) and fast-rate (70 ms ISI) conditions. b, P2 peak amplitudes for all nine electrodes of interest are shown by group (red, AEx; green, PEx; blue, NC) for each tone of the two tone pairs in the 300 ms ISI condition. The four P2 peaks depicted on the x-axis include the P2 responses to the standard pair (two) and from the predeviant standard (one), as well as the P2 peak elicited by the 1200 Hz deviant tone. The AEx group achieved significantly higher amplitudes for the repeated 8oo Hz standard tones compared with the PEx and NC groups. However, all groups had significantly higher amplitudes for the 1200 Hz deviant tone. Bar graphs (error bars indicate SEM) show the mean P2 peak amplitude for each tone. T1, tone 1; T2, tone 2; solid bars, 800 Hz tones; striped bars, 1200 Hz tone. c, P2 peak amplitudes for all nine electrodes of interest by group (red, AEx; green, PEx; blue, NC) for each of the merged tone pairs in the 70 ms ISI condition. Only two P2 peaks are generated at 70 ms ISI. The NC group had significantly lower amplitudes for both the STD (800–800 Hz) and DEV (800–1200 Hz) merged tones compared with those in the AEx and PEx groups. Bar graphs (error bars indicate SEM) show the mean P2 peak amplitude for each tone. T1, Tone 1; T2, tone2; solid bars, STD; striped bars, DEV.
Figure 3.
Figure 3.
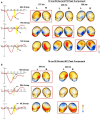
Group differences in latency and amplitude at 70 ms ISI among the three groups at the 7 month post-test. a, Grand average waveforms for all 124 electrodes by group are shown at Fz for the P2 peak on the deviant wave. Highlighted yellow bars on the deviant waveform indicate the location of the maximum P2 peak for each group. Time-locked, age-appropriate topograms to the P2 peak latency by group are also shown. The amplitude scale is shown in microvolts; blue represents negative and red positive activity. A red box around a topogram denotes significantly faster latencies. The AEx group is significantly faster than both the PEx and NC groups, and the PEx group is significantly faster than the NC group. b, Grand average waveforms for all 124 electrodes by group are shown at Fz for the N2* on the deviant wave. Highlighted yellow bars on the deviant waveform indicate the location of the maximum N2* peak for each group. Time-locked, age-appropriate topograms to the N2* peak latency for each group are shown. Amplitude is in microvolts; blue represents negative and red positive activity. A red box around a topogram indicates significantly faster latencies. The AEx and the PEx groups are significantly faster than the NC group.
Figure 4.
Figure 4.
Group differences in morphology for the 70 ms ISI grand average waveform at the 7 month post-test. a, An exemplar waveform from each of the three 7-month-old groups demonstrates the emergence of additional peaks for the AEx group that are not evident for PEx or NC groups. Emerging double peaks (starred) were seen at the 7 month post-test in the majority (78%) of AEx infants at 7 months of age; 41% of the PEx group and 22% of the NC group (χ2 = 8.6, p = 0.01) exhibited this signature maturational profile. b, Morphologically similar double peaks (starred) seen in typically developing 12- and 24-month-old children. (Grand average waveforms at Fz were adapted from Choudhury and Benasich, 2011; plotted at slightly larger scale to accommodate larger-amplitude peaks of the younger infants.) While the double peaks depicted here for the older children are similar morphologically to those seen in the AEx group, typical maturational differences are present for these 12- and 24-month-old children, including faster latencies and smaller amplitudes are seen compared with the 7-month-old children in a.
Figure 5.
Figure 5.
Generalization to nonexposed stimuli in the multideviant paradigm by group at the 7 month post-test: enhanced processing on the standard wave. a, Grand average waveforms for all 124 electrodes at Fz by group to the STD stimulus in the multideviant generalization paradigm. The P1 peak for the STD waveform is significantly faster for the AEx group (solid line) than for the PEx (dashed line) and NC (dotted line) groups. b, Bar graphs (error bars indicate SEM) depicting significantly faster latency of P1 for the STD in the multideviant generalization paradigm for the AEx group (left) when compared with PEx and NC groups. The AEx group also demonstrated smaller, more mature amplitudes for the P1 and N1 peaks compared with those in the PEx and NC groups. All values are plotted from the mean grand averages at Fz.
Figure 6.
Figure 6.
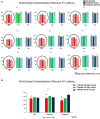
Generalization to nonexposed stimuli in the multideviant paradigm by group at the 7 month post-test: enhanced processing on P1 and N1 for all three deviants. a, Bar graphs depict the mean latency of each DEV at each of the nine electrode sites by group. Significantly faster P1 latencies (p < 0.05) are seen for the AEx group (red) for all three deviants and for all nine electrode sites compared with those in the PEx (green) and NC (blue) groups. Significant differences are circled. b, Bar graphs (error bars indicate SEM) show the mean latency of each group by DEV type (gap, duration, frequency). There were significant group interactions for N1 latency. For each deviant, the AEx group was significantly faster at all electrode sites than the PEx and NC groups (p values < 0.05). A significant interaction revealed that the NC group was significantly slower when processing the frequency deviant. All values are plotted from the mean grand averages at F3.
Figure 7.
Figure 7.
Generalization to nonexposed stimuli in the multideviant paradigm at the 7 month post-test: subgroup differences in the P2–N2 complex on the gap deviant. a, Grand average waveforms for 124 electrodes at Fz to the gap generalization stimulus for all three groups (AEx, PEx, and NC) combined, sorted by P2–N2 subgroup (presence/absence of a P2–N2 complex in the 250–550 ms window). Standard (blue), deviant (red), and difference (green) waves are shown for the gap deviant stimulus. A P2–N2 complex was identified in 71% of the AEx group, 41% of the PEx, and 30% of the NC infants. The AEx group significantly differed from the NC group (χ2 = 4.0, p < 0.05); the PEx and NC groups did not differ from each other (χ2 = 1.8, p = 0.18). b, Grand average waveforms for 124 electrodes at Fz to the gap generalization stimulus for two groups (AEx and NC) combined, sorted by P2–N2 subgroup (absence of P2–N2 vs presence of P2–N2). Standard (blue), deviant (red), and difference (green) waves are shown for the gap deviant stimulus. Significant interactions were seen for all nine electrode sites examined (range, F(1,20) = 5.2–10.8, p < 0.03). Infants in the AEx group who showed the P2–N2 complex had significantly faster latencies and showed better discrimination (i.e., significantly larger mismatch response amplitudes) when compared with those infants who did not show the P2–N2 complex (range, F(1,20) = 5.2–16, p < 0.03).

References

    1. Aslin RN. Discrimination of frequency transitions by human infants. J Acoust Soc Am. 1989;86:582–590. doi: 10.1121/1.398237. - DOI - PubMed
    1. Banai K, Hornickel J, Skoe E, Nicol T, Zecker S, Kraus N. Reading and subcortical auditory function. Cereb Cortex. 2009;19:2699–2707. doi: 10.1093/cercor/bhp024. - DOI - PMC - PubMed
    1. Benasich AA, Tallal P. Infant discrimination of rapid auditory cues predicts later language impairment. Behav Brain Res. 2002;136:31–49. doi: 10.1016/S0166-4328(02)00098-0. - DOI - PubMed
    1. Benasich AA, Choudhury N, Friedman JT, Realpe-Bonilla T, Chojnowska C, Gou Z. The infant as a prelinguistic model for language learning impairments: predicting from event-related potentials to behavior. Neuropsychology. 2006;44:396–411. doi: 10.1016/j.neuropsychologia.2005.06.004. - DOI - PMC - PubMed
    1. Centanni TM, Booker AB, Sloan AM, Chen F, Maher BJ, Carraway RS, Khodaparast N, Rennaker R, LoTurco JJ, Kilgard MP. Knockdown of the dyslexia-associated gene kiaa0319 impairs temporal responses to speech stimuli in rat primary auditory cortex. Cereb Cortex. 2014;24:1753–1766. doi: 10.1093/cercor/bht028. - DOI - PMC - PubMed

Publication types