. 2014 Oct 1;34(40):13549-66.
doi: 10.1523/JNEUROSCI.2021-14.2014.

Genetic labeling reveals novel cellular targets of schizophrenia susceptibility gene: distribution of GABA and non-GABA ErbB4-positive cells in adult mouse brain

Affiliations

Genetic labeling reveals novel cellular targets of schizophrenia susceptibility gene: distribution of GABA and non-GABA ErbB4-positive cells in adult mouse brain

Jonathan C Bean et al. J Neurosci. .

Abstract

Neuregulin 1 (NRG1) and its receptor ErbB4 are schizophrenia risk genes. NRG1-ErbB4 signaling plays a critical role in neural development and regulates neurotransmission and synaptic plasticity. Nevertheless, its cellular targets remain controversial. ErbB4 was thought to express in excitatory neurons, although recent studies disputed this view. Using mice that express a fluorescent protein under the promoter of the ErbB4 gene, we determined in what cells ErbB4 is expressed and their identity. ErbB4 was widely expressed in the mouse brain, being highest in amygdala and cortex. Almost all ErbB4-positive cells were GABAergic in cortex, hippocampus, basal ganglia, and most of amygdala in neonatal and adult mice, suggesting GABAergic transmission as a major target of NRG1-ErbB4 signaling in these regions. Non-GABAergic, ErbB4-positive cells were present in thalamus, hypothalamus, midbrain, and hindbrain. In particular, ErbB4 is expressed in serotoninergic neurons of raphe nuclei but not in norepinephrinergic neurons of the locus ceruleus. In hypothalamus, ErbB4 is present in neurons that express oxytocin. Finally, ErbB4 is expressed in a group of cells in the subcortical areas that are positive for S100 calcium binding protein β. These results identify novel cellular targets of NRG1-ErbB4 signaling.

Keywords: ErbB4; NRG1; Neuregulin; S100β; oxytocin; serotonin.


Figures

Figure 1.
Figure 1.
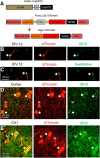
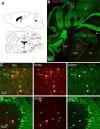
tdTomato labels ErbB4-expressing neurons. A, Schematic of transgenes ErbB4::CreERT2 and Rosa::LSL-tdTomato. A ribosomal 2A skip followed by an inducible Cre recombinase (Cre) estrogen receptor T2 (ERT2) was inserted after endogenous ErbB4 gene stop codon. A CMV-IE enhancer/chicken β-actin/rabbit β-globin hybrid (CAG) promoter, a loxP (yellow triangles) flanked stop cassette, tdTomato red florescent protein, and a woodchuck hepatitis virus post-translational regulatory element (WPRE) were inserted between exon 1 (Ex1) and exon 2 (Ex2) of Rosa26 gene. After CreERT2 is activated by tamoxifen, the stop cassette is removed from Rosa::LSL-tdTomato, resulting in Rosa::tdTomato, and tdTomato will be expressed in all cells that were expressing ErbB4 at time of induction. tdTomato-positive neurons in culture (B, C) and in brain slices (D, E) of ErbB4-reporter mice reacted to polyclonal, 0618 ErbB4 antibody (B, D, E) and monoclonal NeoMarker-H4.77.16 ErbB4 antibody (C). Arrows indicate neurons labeled by tdTomato and antibody. Arrowheads indicate neurons labeled by tdTomato alone.
Figure 2.
Figure 2.
Unique distribution of ErbB4-positive cells in brain regions. Images (photographic negatives) of tdTomato florescence in ErbB4-reporter mouse brain slices illustrating overall ErbB4-positive cell expression. Composite images (A) from a sagittal section 1.80 mm lateral from midline; (B) from a sagittal section 2.52 mm lateral from midline; (C) from a coronal section 4.28 mm relative to bregma; (D) from a coronal section 1.54 mm relative to bregma; (E) from a coronal section −1.06 mm relative to bregma; (F) from a coronal section −3.80 mm relative to bregma; (G) from a coronal section −4.36 mm relative to bregma; and (H) from a coronal section −6.24 mm relative to bregma. A, B, Positions of the sagittal sections were indicated by lines a and b in C–H. C–H, Positions of the coronal sections were indicated by lines c–h in A, B. Amyg, Amygdala; BG, basal ganglia; Cb, cerebellum; Cx, cortex; HB, hindbrain; Hp, hippocampus; Hy, hypothalamus; MB, midbrain; OB, olfactory bulb.
Figure 3.
Figure 3.
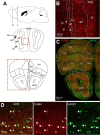
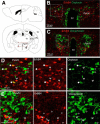
ErbB4-positive cells are enriched in the glomerulus and mitral cell layers of olfactory bulb. A, Diagram of mouse brain sagittal section (top) and coronal sections (middle, bottom). Dashed lines b and c of the sagittal section diagram indicate the position of coronal sections. B, Coronal section of ErbB4-reporter mouse brain, 4.28 mm relative to bregma. Area shown is indicated by the rectangle in the middle panel of A. C, Coronal section of ErbB4-reporter; GAD67::GFP mouse brain, 2.68 mm relative to bregma. Area shown is indicated by the rectangle in the bottom panel of A. D, Enlarged image from the boxed area in C. Arrows indicate neurons positive for ErbB4 and GAD67. Empty arrows indicate neurons positive for GAD67 alone. 1, Layer 1; 2/3, layers 2 and 3; 5, layer 5; AON, anterior olfactory nucleus; DLO, dorsal lateral orbital cortex; FrA, frontal association cortex; gl, glomerulus layer; gr, granular layer; ipl, inner plexiform layer; LO, lateral orbital cortex; MO, medial orbital cortex; MOB, main olfactory bulb; ml, mitral layer; opl, outer plexiform layer; PrL, prelimbic cortex; VO, ventral orbital cortex.
Figure 4.
Figure 4.
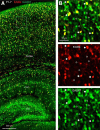
ErbB4-positive cells in cortex are enriched in layer 2/3, are GABAergic interneurons and positive for PV. A, Diagram of mouse brain sagittal (top) and coronal (bottom) sections. Coronal section position is indicated by the dashed line in top. B, Coronal section of ErbB4-reporter mouse brain counterstained with anti-PV, −1.58 mm relative to bregma. Area shown is indicated in the rectangle in A. C, Coronal section of the primary somatosensory cortex (SS1) spanning layers 1–6. Area shown is indicated in the rectangle in B. Arrows indicate neurons positive for ErbB4, GAD67, and PV. Empty arrows indicate neurons positive for ErbB4 and GAD67 but not PV. Arrowhead indicates neurons positive for GAD67 and PV but not ErbB4. Empty arrowhead indicates neurons positive for GAD67 alone. *Cells positive for either ErbB4 or PV but not GAD67. CPu, Caudate–putamen; GI/DI, gustatory and digestive cortex; Hp, hippocampus; Hy, hypothalamus; Ins, insular cortex; LV, lateral ventricle; M1, primary motor cortex; M2, secondary motor cortex; Pir, piriform cortex; RS, retrosplenial cortex; SS1, primary somatosensory cortex; SS2, secondary somatosensory cortex; Th, thalamus.
Figure 5.
Figure 5.
ErbB4-positive cells in cortex and hippocampus of neonatal mice are GABAergic interneurons. A, Coronal section of ErbB4-reporter; GAD67::GFP mouse brain. Expression of tdTomato was induced on P1 and examined on P7. B, Enlarged area of the squared region in A. Arrows indicate neurons positive for ErbB4 and GAD67. Open arrows indicate neurons positive for GAD67 alone. CA1, CA1 area of hippocampus; DG, dentate gyrus of hippocampus; P1–7, postnatal days 1–7.
Figure 6.
Figure 6.
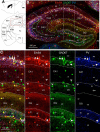
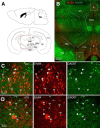
ErbB4-positive cells in hippocampus are concentrated in stratum pyramidal and are GABAergic interneurons and positive for PV. A, Diagram of mouse brain sagittal (top) and coronal (bottom) sections. Coronal section position is indicated by the dashed line in top. B, Coronal section of ErbB4-reporter; GAD67::GFP mouse brain counterstained with anti-PV, −1.58 mm relative to bregma. Area shown is indicated in the rectangle in A. C, Layers of CA1 and DG areas indicated by rectangle in B. Arrows indicate neurons positive for ErbB4, GAD67, and PV. Empty arrows indicate neurons positive for ErbB4 and GAD67 but not PV. Arrowhead indicates neurons positive for GAD67 and PV but not ErbB4. Empty arrowhead indicates neurons positive for GAD67 alone. 3V, Third ventricle; CPu, caudate–putamen; Ect, ectorhinal cortex; gr, granular layer; Hp, hippocampus; Hy, hypothalamus; ml, molecular layer; Pir, piriform cortex; pl, polymorph layer; PRh, perirhinal cortex; PtA, parietal association cortex; slu, stratum lucidum; slm, stratum lacunosum-moleculare; so, stratum oriens; sp, stratum pyramidal; sr, stratum radiatum; RS, retrosplenial cortex; RTN, reticular thalamic nucleus; SS1, primary somatosensory cortex; SS2, secondary somatosensory cortex; Th, thalamus.
Figure 7.
Figure 7.
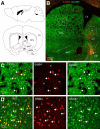
ErbB4-positive cells in the basal ganglia show unique distribution and are GABAergic interneurons. A, Diagram of mouse brain sagittal (top) and coronal (bottom) sections. Coronal section position is indicated by the dashed line in top. B, Coronal section of ErbB4-reporter; GAD67::GFP mouse brain, 0.98 mm relative to bregma. Area shown is indicated by the rectangle in A. C, Caudate–putamen area indicated by square C′. D, Lateral septum area indicated by square D′. Arrows indicate neurons positive for ErbB4 and GAD67. Empty arrows indicate neurons positive for GAD67 alone. AcC, Nucleus accumbens core; AcSh, nucleus accumbens shell; CPu, caudate–putamen; Cx, cortex; DB, diagonal band nucleus; LS, lateral septum; LV, lateral ventricle; Tu, olfactory tubercle.
Figure 8.
Figure 8.
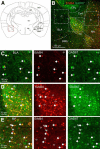
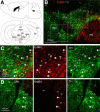
ErbB4-positive cells in the amygdala are concentrated in the intercalated nucleus. A, Diagram of mouse coronal section. The position is indicated by the dashed line in Figure 6A. B, Amygdala of ErbB4-reporter; GAD67::GFP mouse brain, −1.58 mm relative to bregma. Dashed lines indicate nuclei of the amygdala. Areas in squares C′, D′, and E′ are shown in panels C–E. Arrows indicate neurons positive for ErbB4 and GAD67. Empty arrows indicate neurons positive for GAD67 alone. Arrowheads indicate neurons positive for ErbB4 alone. BLA, Basal lateral amygdala; BMA, basal medial amygdala; CeA, central amygdala; Hp, hippocampus; Hy, hypothalamus; IA, intercalated nucleus of the amygdala; MA, medial amygdala; SS1, primary somatosensory cortex; Th, thalamus.
Figure 9.
Figure 9.
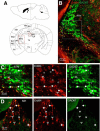
ErbB4-positive cells are enriched in medial habenula. A, Diagram of mouse brain sagittal (top) and coronal (bottom) sections. Dashed line indicates coronal section position. B, Coronal section of ErbB4-reporter; GAD67::GFP mouse brain, −1.58 mm relative to bregma. Position of the section is indicated by rectangle in A. *ErbB4-positive cells with non-neuronal morphology. C, Reticular thalamic nucleus area indicated by square in B. D, Coronal section of medial habenula, −1.58 mm relative to bregma. Position of the section is indicated by smaller box in A. Arrows indicate neurons positive for ErbB4 and GAD67. Empty arrows indicate neurons positive for GAD67 alone. Arrowheads indicate neurons positive for ErbB4 alone. CPu, Caudate–putamen; Ect, ectorhinal cortex; Hp, hippocampus; Hy, hypothalamus; LH, lateral habenula; MH, medial habenula; Th, thalamus; Pir, piriform cortex; PRh, perirhinal cortex; PtA, parietal association cortex; SS1, primary somatosensory cortex; SS2, secondary somatosensory cortex; RS, retrosplenial cortex; RTN, reticular thalamic nucleus.
Figure 10.
Figure 10.
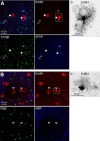
S100β was detected in ErbB4-positive cells in thalamus, hypothalamus, midbrain, and hindbrain. A, B, ErbB4-positive cells in thalamus, with small soma and radiating processes. a, b, Enlarged images of ErbB4-postive cells in rectangles in A and B, respectively. These cells were detected in low density in areas, including hypothalamus (Fig. 11), midbrain (Fig. 14), and hindbrain (Fig. 16) as well as thalamus (Figs. 2E and 9B). Arrows indicate cells positive for ErbB4 and S100β. Empty arrows indicate cells positive for S100β and GFAP but negative for ErbB4. Arrowheads indicate cells positive for ErbB4 alone. Olig2, Oligodendrocyte transcription factor 2.
Figure 11.
Figure 11.
ErbB4-positive cells enriched in the paraventricular and dorsomedial hypothalamic nuclei. A, Diagram of mouse brain sagittal (top) and coronal (middle and bottom) sections. Coronal section positions were indicated by dashed lines b and c. B, Coronal section of ErbB4-reporter; GAD67::GFP mouse brain, −1.06 mm relative to bregma. Area shown is indicated by the rectangle in A middle. Dashed lines indicate hypothalamus nuclei. C, Coronal section of ErbB4-reporter; GAD67::GFP mouse brain, −1.58 mm relative to bregma. *ErbB4-positive cells with non-neuronal morphology. Dashed lines indicate hypothalamus nuclei. D, PaVH, enlarged from the area in the square. Arrows indicate neurons positive for ErbB4 and GAD67. Empty arrows indicate neurons positive for GAD67 alone. Arrowheads indicate neurons positive for ErbB4 alone. AH, Anterior hypothalamic nucleus; Arc, arcuate nucleus; CPu, caudate–putamen; Cx, cortex; DM, dorsomedial hypothalamic nucleus; Hp, hippocampus; Hy, hypothalamus; LH, lateral hypothalamus; MA, medial amygdala; RTN, reticular thalamic nucleus; Th, thalamus; VM, ventral medial hypothalamic nucleus; ZI, zona incerta.
Figure 12.
Figure 12.
ErbB4-positive cells colocalize with oxytocin but not vasopressin in the paraventricular hypothalamic nucleus. A, Diagram of mouse brain sagittal (top) and coronal (bottom) sections. Coronal section position is indicated by the dashed line in top. B, C, Coronal section of ErbB4-reporter mouse brain, −1.06 mm relative to bregma. Shown was the PaVH area, indicated by the rectangle in A. Sections were stained with antibodies against oxytocin (B) or vasopressin (C). D, E, PaVH areas stained with anti-oxytocin (D) or anti-vasopressin (E). Areas shown were indicated by squares in B and C, respectively. Arrows indicate neurons positive for ErbB4 and oxytocin. Empty arrows indicate neurons positive for oxytocin or vasopressin alone. Arrowheads indicate neurons positive for ErbB4 alone. 3V, Third ventricle; CPu, caudate–putamen; Cx, cortex; Hp, hippocampus; Hy, hypothalamus; RTN, reticular thalamic nucleus; Th, thalamus.
Figure 13.
Figure 13.
ErbB4-positive cells in the midbrain. A, Diagram of mouse brain sagittal (top) and coronal (bottom) sections. Coronal section position is indicated by the dashed line in top. B, Coronal section of ErbB4-reporter; GAD67::GFP mouse brain, −3.08 mm relative to bregma. Dashed lines indicate midbrain nuclei. C, D, Superior colliculus and VTA, indicated by square C′ and D′ in B, respectively. Arrows indicate neurons positive for ErbB4 and GAD67. Empty arrows indicate neurons positive for GAD67 alone. Arrowheads indicate neurons positive for ErbB4 alone. Cx, Cortex; Hp, hippocampus; IF, interfascicular nucleus; MM, medial mammillary nucleus; PAG, periaqueductal gray; SC, superior colliculus; SNr, substantia nigra reticular part; SNc, substantia nigra compact part; VTA, ventral tegmental area.
Figure 14.
Figure 14.
ErbB4-positive cells colocalize with TH in midbrain. A, Diagram of mouse brain sagittal (top) and coronal (bottom) sections. Coronal section position is indicated by the dashed line in top. B, Coronal section of ErbB4-reporter mouse brain, −3.80 mm relative to bregma. *Non-neuronal ErbB4-positive cells. C, D, VTA and SNc, indicated by squares C′ and D′, respectively. Arrows indicate neurons positive for ErbB4 and TH. Empty arrows indicate neurons positive for TH alone. Arrowheads indicate neurons positive for ErbB4 alone. Cx, Cortex; Hp, hippocampus; IPN, interpeduncular nucleus; PAG, periaqueductal gray; PN, pontine nucleus; RLi, rostral linear nucleus; RN, red nucleus; SC, superior colliculus; SNr, substantia nigra reticular part; SNc, substantia nigra compact part; VTA, ventral tegmental area.
Figure 15.
Figure 15.
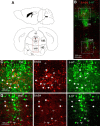
ErbB4-positive cells colocalize with serotonin neurons in raphe nuclei. A, Diagram of mouse brain sagittal (top) and coronal (bottom) sections. Coronal section position is indicated by the dashed line in top. B, Coronal section of ErbB4-reporter mouse brain, −4.36 mm relative to bregma. Sections were stained with anti-5-HT antibody (green). C, D, Dorsal raphe of the midbrain and median raphe of the hindbrain, indicated by squares C′ and D′, respectively. Arrows indicate neurons positive for ErbB4 and 5-HT. Empty arrows indicate neurons positive for 5-HT alone. Arrowheads indicate neurons positive for ErbB4 alone. DR, Dorsal raphe; LL, lateral lemniscus; MnR, median raphe; PAG, periaqueductal gray; PN, pontine nucleus; SC, superior colliculus.
Figure 16.
Figure 16.
ErbB4-positive cells do not colocalize with TH in the locus ceruleus. A, Diagram of mouse brain sagittal (left) and coronal (right) sections. Coronal section position is indicated by the dashed line at left. B, Coronal section of ErbB4-reporter mouse brain, −5.34 mm relative to bregma. Sections were stained with anti-TH antibody (green). *ErbB4-positive non-neuronal cells. C, Locus ceruleus, indicated by the square in B. Arrows indicate neurons positive for TH alone. Arrowheads indicate neurons positive for ErbB4 alone. 4V, Fourth ventricle; IC, inferior colliculus; LC, locus ceruleus; Pb, parabrachial nucleus; PCG, pontine central gray.
Figure 17.
Figure 17.
ErbB4-positive cells in the cerebellum and hindbrain. A, Diagram of mouse brain sagittal (top) and coronal (bottom) sections. Coronal section position is indicated by the dashed line in top. B, Coronal section of ErbB4-reporter; GAD67::GFP mouse brain, −5.52 mm relative to bregma. C, D, Spinal trigeminal nucleus and simple lobule of cerebellum. Areas shown were indicated by squares C′ and D′ in B. Arrows indicate neurons positive for ErbB4 and GAD67. Empty arrows indicate neurons positive for GAD67 alone. Arrowheads indicate cells positive for ErbB4 alone. 4V, Fourth ventricle; 7N, facial nucleus; Cch, cochlear nucleus; Cul, culmen lobule; Crus 1, Crus 1 of the ansiform lobule; GI, gigantocellular reticular nucleus; IC, inferior colliculus; Ling, lingual lobule; PFI, paraflocculus lobule; RMg, raphe magnus nucleus; Sim, simple lobule; SP5, spinal trigeminal nucleus; Ve, vestibular nucleus.
Figure 18.
Figure 18.
ErbB4-positive cells in the corpus callosum and choroid plexus. A, Diagram of mouse brain coronal sections, −0.94 mm relative to bregma. Coronal section position is indicated by the dashed line in Figure 12A. B, C, Corpus callosum and choroid plexus in the lateral ventricle. Areas shown were indicated by squares B′ and C′, respectively. Arrows indicate cells positive for ErbB4 and GAD67. Empty arrows indicate cells positive for GAD67 alone.

References

    1. Abe Y, Namba H, Zheng Y, Nawa H. In situ hybridization reveals developmental regulation of ErbB1–4 mRNA expression in mouse midbrain: implication of ErbB receptors for dopaminergic neurons. Neuroscience. 2009;161:95–110. doi: 10.1016/j.neuroscience.2009.03.022. - DOI - PubMed
    1. Abe Y, Namba H, Kato T, Iwakura Y, Nawa H. Neuregulin-1 signals from the periphery regulate AMPA receptor sensitivity and expression in GABAergic interneurons in developing neocortex. J Neurosci. 2011;31:5699–5709. doi: 10.1523/JNEUROSCI.3477-10.2011. - DOI - PMC - PubMed
    1. Anton ES, Ghashghaei HT, Weber JL, McCann C, Fischer TM, Cheung ID, Gassmann M, Messing A, Klein R, Schwab MH, Lloyd KC, Lai C. Receptor tyrosine kinase ErbB4 modulates neuroblast migration and placement in the adult forebrain. Nat Neurosci. 2004;7:1319–1328. doi: 10.1038/nn1345. - DOI - PubMed
    1. Barros CS, Calabrese B, Chamero P, Roberts AJ, Korzus E, Lloyd K, Stowers L, Mayford M, Halpain S, Müller U. Impaired maturation of dendritic spines without disorganization of cortical cell layers in mice lacking NRG1/ErbB signaling in the central nervous system. Proc Natl Acad Sci U S A. 2009;106:4507–4512. doi: 10.1073/pnas.0900355106. - DOI - PMC - PubMed
    1. Bruce LL, Kornblum HI, Seroogy KB. Comparison of thalamic populations in mammals and birds: expression of ErbB4 mRNA. Brain Res Bull. 2002;57:455–461. doi: 10.1016/S0361-9230(01)00678-5. - DOI - PubMed

Publication types

LinkOut - more resources