. 2014 Dec;88(24):14172-83.
doi: 10.1128/JVI.02254-14. Epub 2014 Oct 1.

Anterograde glycoprotein-dependent transport of newly generated rabies virus in dorsal root ganglion neurons

Affiliations

Anterograde glycoprotein-dependent transport of newly generated rabies virus in dorsal root ganglion neurons

Anja Bauer et al. J Virol. 2014 Dec.

Abstract

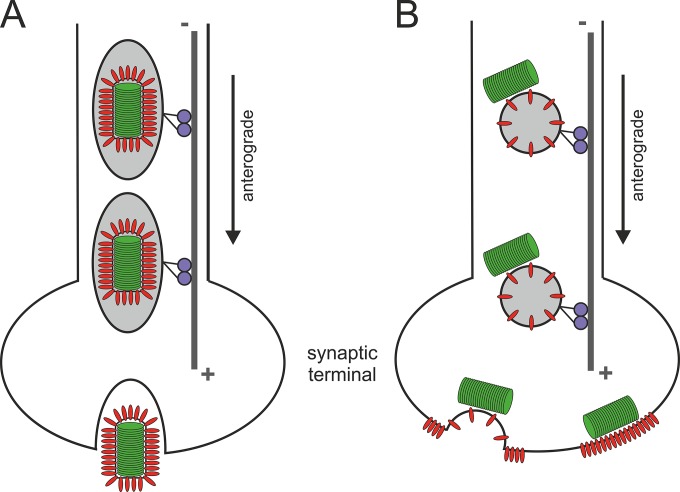
Rabies virus (RABV) spread is widely accepted to occur only by retrograde axonal transport. However, examples of anterograde RABV spread in peripheral neurons such as dorsal root ganglion (DRG) neurons indicated a possible bidirectional transport by an uncharacterized mechanism. Here, we analyzed the axonal transport of fluorescence-labeled RABV in DRG neurons by live-cell microscopy. Both entry-related retrograde transport of RABV after infection at axon endings and postreplicative transport of newly formed virus were visualized in compartmentalized DRG neuron cultures. Whereas entry-related transport at 1.5 μm/s occurred only retrogradely, after 2 days of infection, multiple particles were observed in axons moving in both the anterograde and retrograde directions. The dynamics of postreplicative retrograde transport (1.6 μm/s) were similar to those of entry-related retrograde transport. In contrast, anterograde particle transport at 3.4 μm/s was faster, indicating active particle transport. Interestingly, RABV missing the glycoproteins did not move anterogradely within the axon. Thus, anterograde RABV particle transport depended on the RABV glycoprotein. Moreover, colocalization of green fluorescent protein (GFP)-labeled ribonucleoproteins (RNPs) and glycoprotein in distal axonal regions as well as cotransport of labeled RNPs with membrane-anchored mCherry reporter confirmed that either complete enveloped virus particles or vesicle associated RNPs were transported. Our data show that anterograde RABV movement in peripheral DRG neurons occurs by active motor protein-dependent transport. We propose two models for postreplicative long-distance transport in peripheral neurons: either transport of complete virus particles or cotransport of RNPs and G-containing vesicles through axons to release virus at distal sites of infected DRG neurons.

Importance: Rabies virus retrograde axonal transport by dynein motors supports virus spread over long distances and lethal infection of the central nervous system. Though active rabies virus transport has been widely accepted to be unidirectional, evidence for anterograde spread in peripheral neurons supports the hypothesis that in some neurons RABV also enters the anterograde pathway by so-far unknown mechanisms. By live microscopy we visualized fast anterograde axonal transport of rabies virus. The velocities exceeded those of retrograde movements, suggesting that active, most likely kinesin-dependent transport machineries are involved. Dependency of anterograde transport on the expression of virus glycoprotein G and cotransport with vesicles further suggest that complete enveloped virus particles or cotransport of virus ribonucleoprotein and G-containing vesicles occurred. These data provide the first insight in the mechanism of anterograde rabies virus transport and substantially contribute to the understanding of RABV replication and spread of newly formed virus in peripheral neurons.


Figures

FIG 1
FIG 1
Chambered dorsal root ganglion (DRG) neuron cultivation, directed infection, and EGFP-P detection in infected neurons. (A) DRG neurons were prepared from rat embryos and seeded in cell culture devices in which the two chambers were connected by an agarose-filled channel. After 2 weeks, axonal growth cones reached the distal chamber. Directed infections at growth cones (distal chamber) or at the cell bodies (proximal chamber) allowed imaging of virus infections and intra-axonal transport within axons. Virus infections were monitored directly after infection (0 days postinfection [dpi]; retrograde virus entry) or postreplicative after 1 to 5 days of infection. (B) DRG neuron cultures were infected at the growth cones (right side) with rRABV EGFP-P DLC1mut Gcvs (genome organization is shown at the top). After 5 days of infection, GFP autofluorescence was detected in the cell bodies (left side), in bundled axons (middle), and in distal chambers (right side). Upper two rows, bright-field and fluorescence images of cultivation devices. The images were assembled from 48 fields of view. Lower two rows, magnifications from proximal and distal chambers (right and left sides, respectively) and from the middle of the channel (middle).
FIG 2
FIG 2
RABV retrograde axonal transport. DRG neurons were infected with rRABV EGFP-P DLC1mut Gcvs at the distal growth cones. After 170 min, virus particle transport was observed by image acquisition in the middle part of the channels (0.276 s/frame; optical slice = 1.5 μm). (A) Transport of a single virus particle into the retrograde direction. From a total of 181 time frames, every 20th image is shown. The transported virus particle is marked by circles. (B) Time projection of 842 time frames. (C) Particle transport velocities were determined for each time frame and were categorized as indicated in the diagram. The frequencies of different transport velocities are shown. Data have been generated from eight trajectories, comprising a total of 817 individual transport events.
FIG 3
FIG 3
Postreplicative axonal transport. DRG neurons were infected in the proximal chamber, and EGFP-P particle transport in axons was monitored after 48 h of infection by z-stack acquisition (5 optical slices per stack; acquisition rate, 0.503 s/stack; optical slice = 1.5 μm; size depth = 6 μm). (A) Directed transport in the anterograde (left) and retrograde (right) directions was visualized by trajectories for individual particles. The left and right images represent identical time points and areas. (B) Particle transport velocities were determined for each time frame and were categorized as indicated in the diagram. The frequencies of different transport velocities are shown for retro- and anterograde transport processes (black and gray bars, respectively). Anterograde transport velocities were calculated from 15 trajectories consisting of 636 individual transport events. Retrograde transport velocities were calculated from seven trajectories consisting of 512 transport events.
FIG 4
FIG 4
Colocalization of EGFP-P and nucleoprotein N in axons. Immunostaining against nucleoprotein N after 3 days of infection in distal parts of DRG axons is shown. (A) Maximum z-projection of 34 optical slices (0.772 μm each; size depth = 11.1 μm). (B) Detail from panel A, showing a single optical slice (z = 0.772 μm). Scale bar, 3 μm.
FIG 5
FIG 5
Exclusion of NDV phosphoprotein from anterograde transport in axons. DRG neurons were infected at the cell soma with rRABV EGFP-P Gcvs and recombinant NDV expressing EGFP-tagged NDV P protein (rNDVF1 EGFP-P). EGFP-P fluorescence was monitored at 4 dpi within the cell soma (proximal chamber) and in the channel at proximal areas close to the cell soma side (middle row) and in more distant distal areas (bottom row). Note that brightness/contrast was increased (to 100) for rNDVF1 EGFP-P fluorescence within the image section (cell soma) and in images from channel areas.
FIG 6
FIG 6
Postreplicative axonal transport of EGFP-P particles is G protein dependent. DRG neurons were infected with rRABV EGFP-P Gcvs and G gene-deleted rRABV EGFP-P ΔG at the cell soma. Upper row, cells were fixed after 2 days of infection and were immunostained with G-specific monoclonal antibody E559. Merged images of red G signals and green EGFP-P autofluorescence are shown. Detail, G-specific fluorescence only. Lower row, after 4 days of infection, axonal EGFP-P fluorescence of living neurons was monitored within channels. The images represent maximum z-projections of seven optical slices (0.772 μm each; size depth = 4.5 μm).
FIG 7
FIG 7
Colocalization of RABV G and EGFP-P in distal chambers. DRG neuron cultures were infected with rRABV EGFP-P Gcvs or rRABV EGFP-P ΔG at the cell soma. At 2 dpi, neurons were fixed and immunostained with G-specific MAb E559. Optical slice = 0.772 μm. (a to c) Axons of rRABV EGFP-P Gcvs-infected neurons in the distal chamber. (d to f) Magnification of distal axons, with EGFP-P and G colocalization indicated by arrowheads. Particles exhibiting only green or red fluorescence are indicated by arrows. Scale bar, 1 μm. (g to i) Axons of rRABV EGFP-P ΔG-infected neurons in the distal chamber. Only diffusely distributed GFP fluorescence in axons and bouton-like axon swellings was observed, indicating the presence of soluble EGFP-P in the distal axon parts.
FIG 8
FIG 8
Cotransport of EGFP-P particles and tmCherry-labeled vesicles. DRG neuron cultures were coinfected with rRABV EGFP-P Gcvs and rRABV tmCherry in the cell soma. After 3 days of infection, axonal transport of EGFP-P (green) and tmCherry (red) was monitored within the channels (0.336 s/frame; optical slice = 0.772 μm). (A) Colocalization of EGFP and mCherry fluorescence in transported particles. Upper three rows, t-projections with red, green, and merged images. Arrows, coinfected neurons. The dashed lines indicate the time period and area used for single-particle tracking as shown below. The image sequence was derived from 25 time frames, and every third image is shown. Scale bar, 1 μm. (B) Genome organization of rRABV EGFP-P Gcvs and rRABV tmCherry. The tmCherry protein consists of RABV G-derived signal peptide and transmembrane and cytoplasmic sequences (SP, TM, and Cyt, respectively). (C) Single-particle analysis with time projection of an anterograde particle transport process. Shown are merged images (1-μm2 details of an individual transported particle) from 60 consecutive frames. The frame order is indicated at the left. (D) t-projections of neurons infected exclusively with rRABV EGFP-P Gcvs or rRABV tmCherry. Scale bar, 1 μm.
FIG 9
FIG 9
Model of intraneuronal postreplicative RABV transport. Either complete, enveloped virus particles are transported within exocytotic vesicles (A) or cotransport of cytoplasmic RNPs and G-containing transport vesicles may occur (B). Whereas the former mode may allow release of complete virus particles at axon termini or presynaptic membranes, the cotransport model would allow local concentration of both viral glycoprotein and RNPs at distal sites of virus assembly. After fusion of the transport vesicle with presynaptic membranes, the RNP is positioned directly beneath the G-enriched presynaptic membrane, and virus particles may be assembled by a subsequent budding event.

References

    1. Koyuncu OO, Hogue IB, Enquist LW. 2013. Virus infections in the nervous system. Cell Host Microbe 13:379–393. 10.1016/j.chom.2013.03.010. - DOI - PMC - PubMed
    1. Salinas S, Schiavo G, Kremer EJ. 2010. A hitchhiker's guide to the nervous system: the complex journey of viruses and toxins. Nat. Rev. Microbiol. 8:645–655. 10.1038/nrmicro2395. - DOI - PubMed
    1. Lycke E, Tsiang H. 1987. Rabies virus infection of cultured rat sensory neurons. J. Virol. 61:2733–2741. - PMC - PubMed
    1. Jacob Y, Badrane H, Ceccaldi PE, Tordo N. 2000. Cytoplasmic dynein LC8 interacts with lyssavirus phosphoprotein. J. Virol. 74:10217–10222. 10.1128/JVI.74.21.10217-10222.2000. - DOI - PMC - PubMed
    1. Raux H, Flamand A, Blondel D. 2000. Interaction of the rabies virus P protein with the LC8 dynein light chain. J. Virol. 74:10212–10216. 10.1128/JVI.74.21.10212-10216.2000. - DOI - PMC - PubMed

Publication types

LinkOut - more resources