. 2014 Oct 2;10(10):e1003865.
doi: 10.1371/journal.pcbi.1003865. eCollection 2014 Oct.

Natural isotopic signatures of variations in body nitrogen fluxes: a compartmental model analysis

Affiliations

Natural isotopic signatures of variations in body nitrogen fluxes: a compartmental model analysis

Nathalie Poupin et al. PLoS Comput Biol. .

Abstract

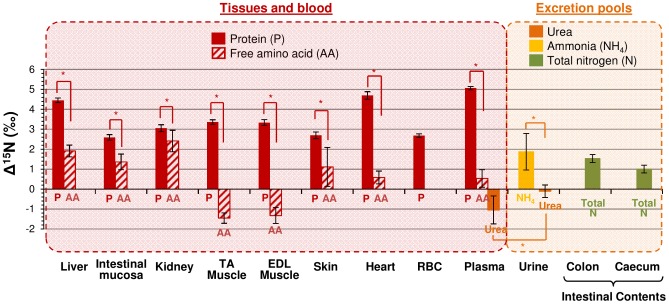
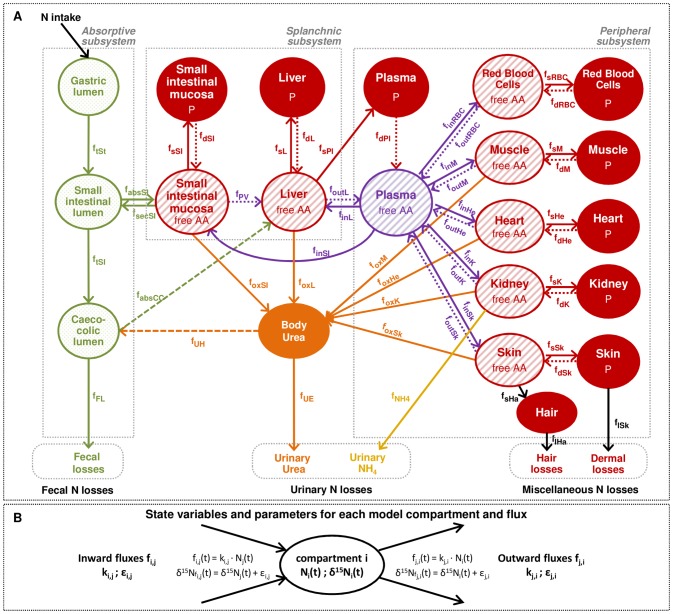
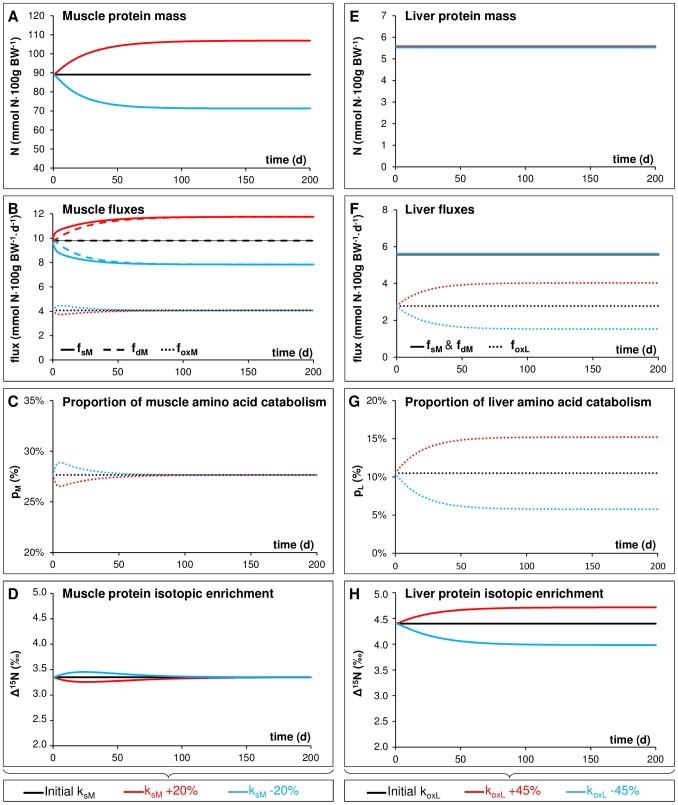
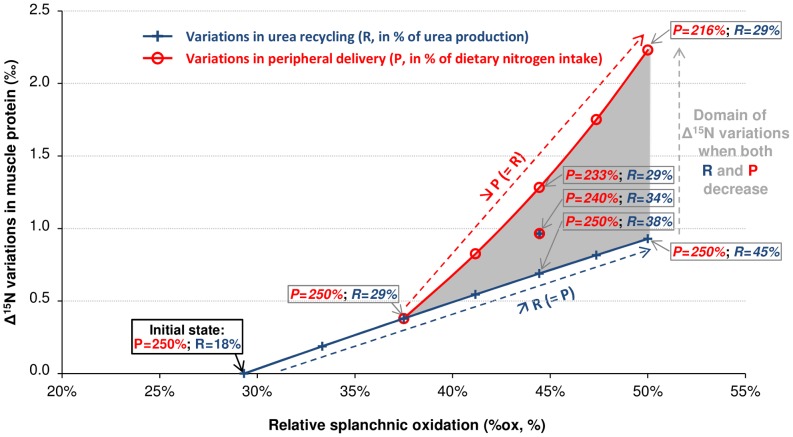
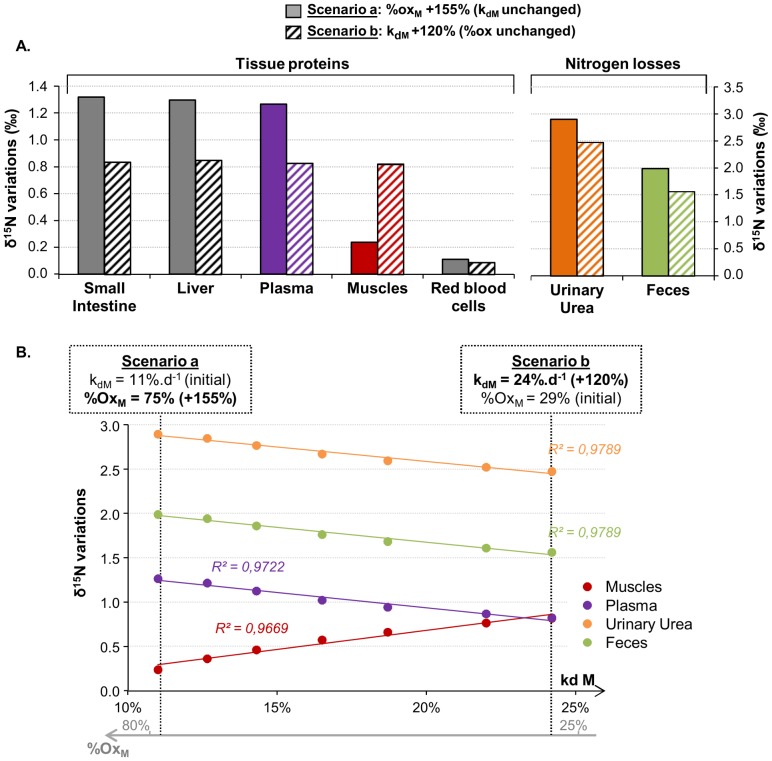
Body tissues are generally 15N-enriched over the diet, with a discrimination factor (Δ15N) that varies among tissues and individuals as a function of their nutritional and physiopathological condition. However, both 15N bioaccumulation and intra- and inter-individual Δ15N variations are still poorly understood, so that theoretical models are required to understand their underlying mechanisms. Using experimental Δ15N measurements in rats, we developed a multi-compartmental model that provides the first detailed representation of the complex functioning of the body's Δ15N system, by explicitly linking the sizes and Δ15N values of 21 nitrogen pools to the rates and isotope effects of 49 nitrogen metabolic fluxes. We have shown that (i) besides urea production, several metabolic pathways (e.g., protein synthesis, amino acid intracellular metabolism, urea recycling and intestinal absorption or secretion) are most probably associated with isotope fractionation and together contribute to 15N accumulation in tissues, (ii) the Δ15N of a tissue at steady-state is not affected by variations of its P turnover rate, but can vary according to the relative orientation of tissue free amino acids towards oxidation vs. protein synthesis, (iii) at the whole-body level, Δ15N variations result from variations in the body partitioning of nitrogen fluxes (e.g., urea production, urea recycling and amino acid exchanges), with or without changes in nitrogen balance, (iv) any deviation from the optimal amino acid intake, in terms of both quality and quantity, causes a global rise in tissue Δ15N, and (v) Δ15N variations differ between tissues depending on the metabolic changes involved, which can therefore be identified using simultaneous multi-tissue Δ15N measurements. This work provides proof of concept that Δ15N measurements constitute a new promising tool to investigate how metabolic fluxes are nutritionally or physiopathologically reorganized or altered. The existence of such natural and interpretable isotopic biomarkers promises interesting applications in nutrition and health.


Conflict of interest statement

The authors have declared that no competing interests exist.

Figures

Figure 1
Figure 1. Natural nitrogen isotopic abundances of metabolic pools in rats under standard conditions.
Isotopic abundances, measured in the protein (P) and free amino acid (AA) fractions of tissues and blood, in plasma urea, in urinary urea and ammonia (NH4), and in the total nitrogen (N) of intestinal contents, are expressed as the difference between the measured natural 15N enrichment of the pool and that of the diet (Δ15Npool = δ15Ntissue−δ15Ndiet). RBC, Red blood cells; TA, Tibialis anterior; EDL, Extensor digitorum longus. Asterisks indicate significant Δ15N differences between two N fractions (P<0.01, independent Student t-tests).
Figure 2
Figure 2. Multi-compartmental model describing the body system of nitrogen fluxes and isotopic signatures in rats.
(A) Circles indicate model compartments, representing kinetically homogeneous nitrogen (N) pools and belonging to three subsystems: the absorptive (luminal N contents of the gastrointestinal tract), splanchnic (protein (P) and free amino acid (AA) fractions of small intestine and liver) and peripheral (P and AA fractions of plasma, muscles, kidneys, heart, red blood cells (RBC), skin and hair) subsystems. Arrows between compartments indicate N fluxes corresponding to N transfers and/or metabolic processes. The following fluxes are represented: gastrointestinal N exchanges (gastric emptying, ftSt; intestinal transit, ftSI; intestinal absorption, fabsSI; intestinal secretion of endogenous proteins, fsecSI; caeco-colonic absorption, fabsCC; body urea transfer toward the colon, fUH), N excretion (fecal losses, fFL; urinary urea excretion, fUE; urinary ammonia production and excretion, fNH4; hair losses, flHa; desquamation losses, flSk), tissue P synthesis (fsT, for a given tissue T), tissue P degradation (fdT), tissue AA catabolism through oxidation (foxT), AA transfers from plasma to tissues (finT) and from tissues to plasma (foutT), and AA transfer from the intestine toward the liver through the portal vein (fPV). Each oxidation flux foxT aggregates both the transfer of AA from tissue to liver and their subsequent deamination and use for urea synthesis in liver, and the total body urea production is equal to the sum of all tissue oxidation fluxes. fUH represents enterohepatic urea recycling, (i.e., the part of the urea produced that is not excreted in urine but recycled and hydrolysed by the colonic bacteria), leading to the production of ammonia that can be used either for microbial metabolism or salvaged (i.e., reabsorbed and made available for subsequent metabolic purposes). The amount of ammonia arising from urea hydrolysis that is reabsorbed from the colon is accounted for in fabsCC together with the absorption of other endogenous and dietary N compounds. (B) Each model compartment i is characterized by two state variables: its N size (Ni, mmol N.100 g BW−1) and its isotopic abundance (δ15Ni, ‰). Each N flux from compartment j to compartment i (fi,j) is characterized by two constant parameters: its reaction rate (ki,j, d−1) and its fractionation factor (εi,j, ‰). ki,j (kj,i) corresponds to the fraction of compartment j (i) that is transferred to compartment i (j) per day, and εi,jj,i) represents the isotopic effect associated with flux fi,j (fj,i). The k and ε parameters are used respectively to describe flux size (fi,j, mmol N.100 g BW−1.d−1) and isotopic enrichment (δ15Nfi,j, ‰).
Figure 3
Figure 3. Predicted changes in protein masses, fluxes and isotopic abundances in muscle and liver following simulated variations of the nitrogen fluxes in these tissues (Simulations #1 and #2).
Model predictions of dynamic changes in protein mass, nitrogen fluxes and protein-to-diet 15N enrichment (Δ15N) in muscle (Simulation #1, A–D) and in liver (Simulation #2, E–H) were obtained by simulating two typical kinds of nutritionally-induced changes in the nitrogen fluxes of these tissues, i.e., variations in muscle protein turnover and hepatic amino acid catabolism, respectively. Under Simulation #1 (A–D), reported elemental and isotopic variations resulted from a simulated and gradual 20% increase or decrease in the muscle protein synthesis rate (ksM) with consequent changes in muscle protein mass. Under Simulation #2 (E–H), reported variations were obtained from a simulated and gradual 45% increase or decrease in the hepatic amino acid oxidation rate (koxL) without any impact on the liver protein mass as a result of a concomitant counterbalancing modulation in urea recycling (through an increase in kUH and kabsCC). The p index represents the relative proportion of amino acids entering the tissue that is directed toward catabolism by comparison with net protein synthesis (pT = foxT/(foutT+foxT+fsT−fdT), with T corresponding to muscle (pM, panel C) or liver (pL, panel G)).
Figure 4
Figure 4. Variations in muscle nitrogen isotopic abundances in relation to combined variations in splanchnic oxidation, urea recycling and peripheral delivery (Simulation #3).
Variations in 15N enrichment over the diet (Δ15N) of muscle proteins were simulated in response to balanced, homeostatic changes in relative splanchnic oxidation (%ox, in %) and in the efficiencies of urea recycling (R, as a % of urea production) and peripheral delivery (P, as a % of dietary nitrogen intake), which might result from qualitative and/or quantitative variations in dietary protein intake. %ox is defined as the proportion of splanchnic amino acid utilization for protein synthesis and oxidation (%ox = foxSpl/(foxSpl+fsSpl), with foxSpl = foxL+foxSI and fsSpl = fsL+fsPl+fsSI), R = fUH/fUP and P = foutL (see Figure 2). Variations in %ox were simulated through changes in the koxSI and koxL parameter values, while variations in R and P were respectively achieved through changes in the kUH and koutL parameter values. The blue line corresponds to simulations under which a 0 to 71% increase in the initial %ox (i.e., %ox increasing from 29% to 50%), was entirely offset by a 0% to 148% increase in the initial R (i.e., R increasing from 18% to 45%), with no change in P. The red line corresponds to simulations under which a 28 to 71% increase in the initial %ox was counterbalanced by a decrease in P ranging from 0 to 13% (i.e., P decreasing from 250% to 216%), with R being fixed at 29% (i.e., 60% higher than its initial value). The shaded area between the red and blue lines corresponds to intermediate scenarios under which the increase in %ox was counterbalanced to varying degrees by an increase in R (ranging from 60% to 148%) and a decrease in P (ranging from 0 to 13%). Within this area, a similar Δ15N variation (corresponding to a horizontal line) could be obtained for different combinations of R and P variations. Variations in Δ15N are expressed as the difference between final and initial steady state Δ15N values.
Figure 5
Figure 5. Variations in nitrogen isotopic abundances under starvation depending on associated metabolic changes (Simulation #4).
Predicted variations in nitrogen isotopic abundances (δ15N) of tissue proteins, urine and faeces were obtained when mimicking starvation conditions, by simulating a zero nitrogen intake for 7 d and altered muscle nitrogen fluxes causing a loss of muscle protein mass. We compared several scenarios under which an identical 45% decrease in muscle protein mass was obtained by increasing, to varying degrees, the muscle protein breakdown rate (kdM, corresponding to the protein degradation efficiency) and/or the proportion of muscle amino acid oxidized rather than utilized for protein synthesis (%oxM = foxM/(foxM+fsM), see Figure 2). (A) Scenarios a and b represent the two extreme scenarios. Scenario a corresponds to a 155% increase in %oxM (%oxM = 75% vs 29% before starvation, through an 80% increase in koxM and a 75% decrease in ksM) without changing kdM. Under scenario b, kdM is increased by 120% (kdM = 24%.d−1 vs 11%.d−1 before starvation) without changing %oxM. (B) δ15N variations were predicted in some characteristic pools (muscle and plasma proteins and urinary urea and fecal nitrogen) for intermediary combinations of changes in both %oxM (from 0 to 155% of its pre-starvation value) and kdM (from 0 to 120% of its pre-starvation value) leading to the same muscle protein mass loss: δ15N variations in pools are linearly correlated with changes in kdM and %oxM (correlation coefficients R2 ranging from 0.97 to 0.98, P<0.01).

Similar articles

Cited by

References

    1. Davis TA, Reeds PJ (2001) Of flux and flooding: the advantages and problems of different isotopic methods for quantifying protein turnover in vivo: II. Methods based on the incorporation of a tracer. Curr Opin Clin Nutr Metab Care 4: 51–56. - PubMed
    1. Fouillet H, Bos C, Gaudichon C, Tome D (2002) Approaches to quantifying protein metabolism in response to nutrient ingestion. J Nutr 132: 3208S–3218S. - PubMed
    1. Tessari P, Garibotto G (2000) Interorgan amino acid exchange. Curr Opin Clin Nutr Metab Care 3: 51–57. - PubMed
    1. Wagenmakers AJ (1999) Tracers to investigate protein and amino acid metabolism in human subjects. Proc Nutr Soc 58: 987–1000. - PubMed
    1. Reitsema LJ (2013) Beyond diet reconstruction: stable isotope applications to human physiology, health, and nutrition. Am J Hum Biol 25: 445–456. - PubMed

Publication types

LinkOut - more resources