. 2014 Oct 2:3:e02862.
doi: 10.7554/eLife.02862.

Delivery of circulating lipoproteins to specific neurons in the Drosophila brain regulates systemic insulin signaling

Affiliations

Delivery of circulating lipoproteins to specific neurons in the Drosophila brain regulates systemic insulin signaling

Marko Brankatschk et al. Elife. .

Abstract

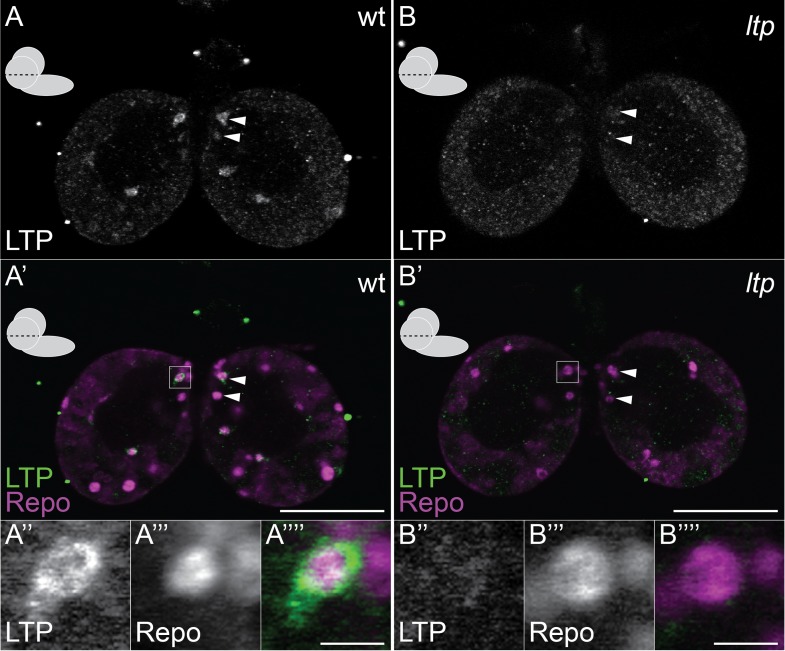
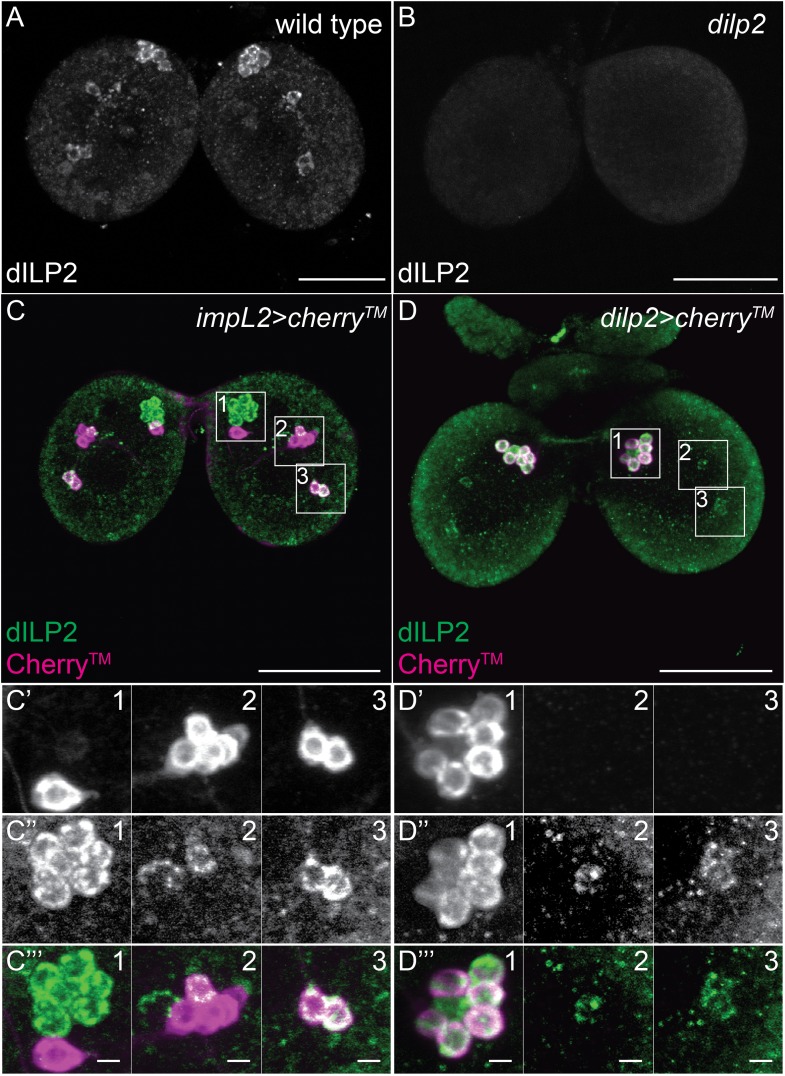
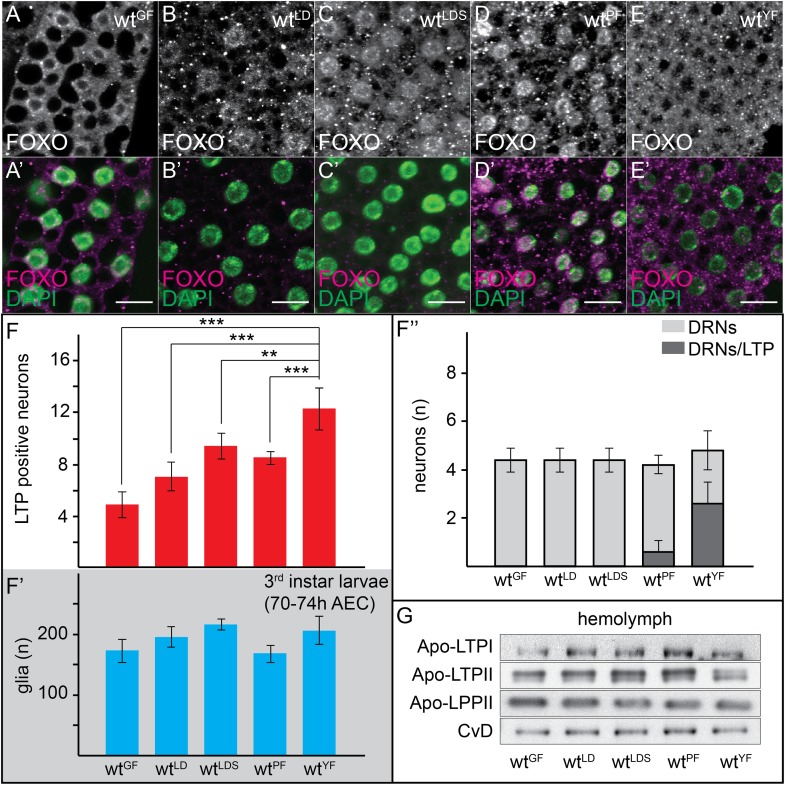
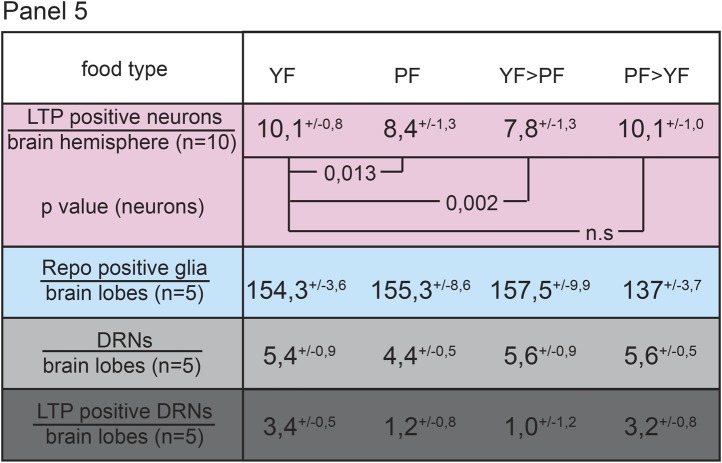
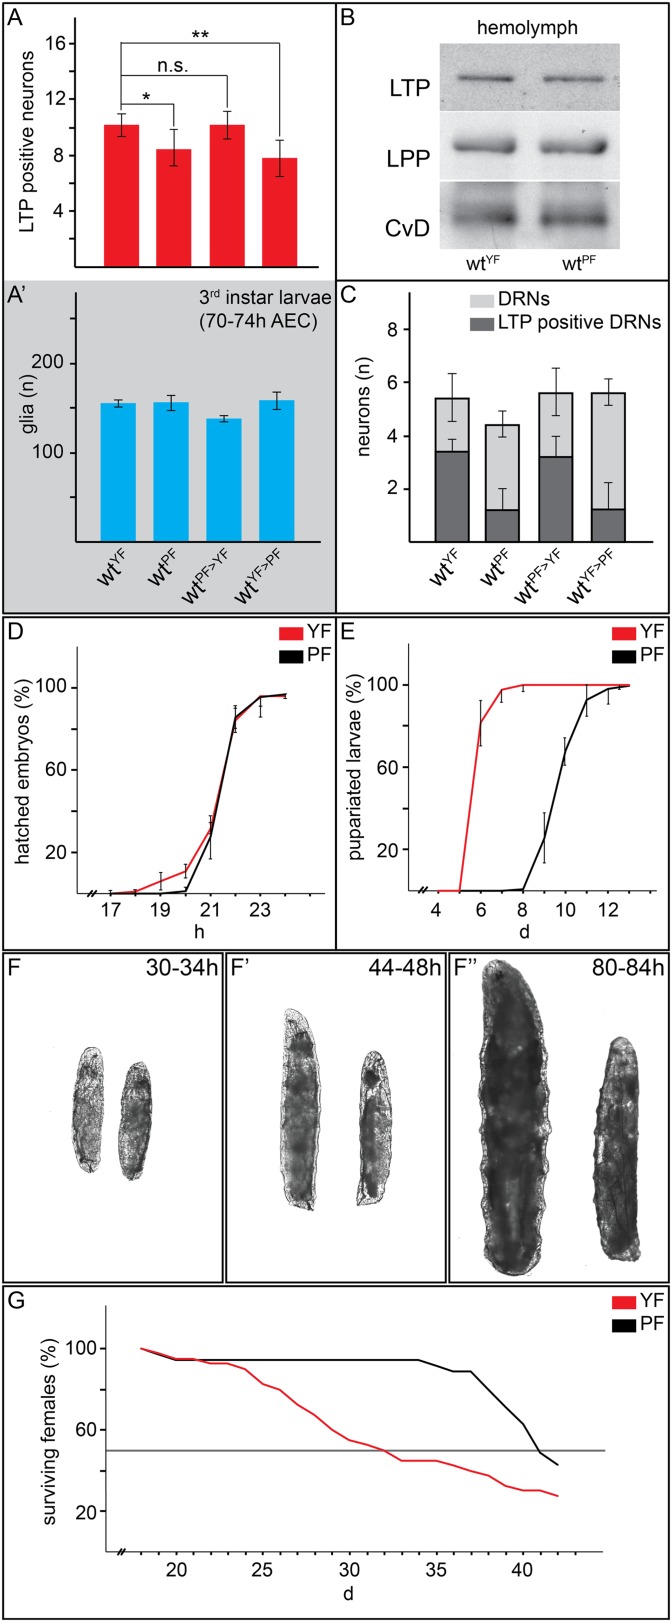
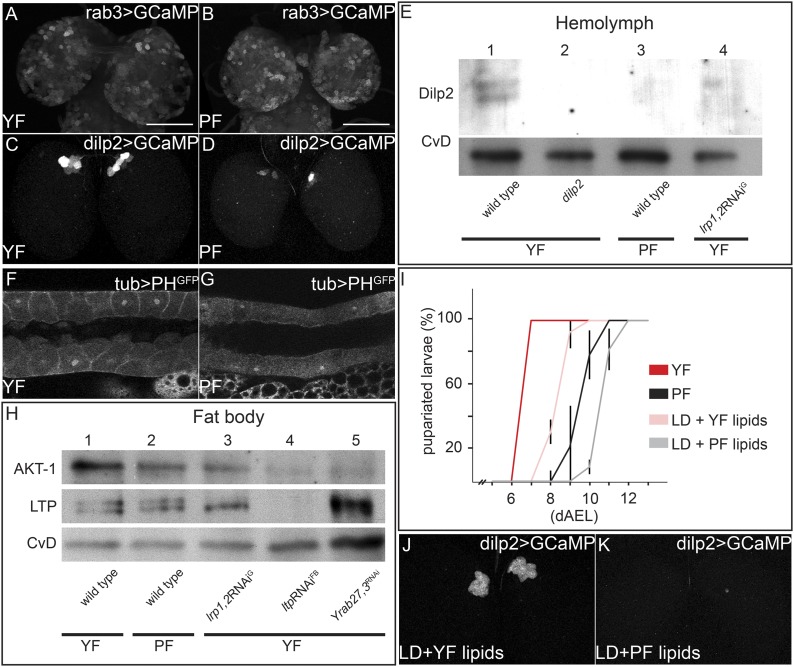
The Insulin signaling pathway couples growth, development and lifespan to nutritional conditions. Here, we demonstrate a function for the Drosophila lipoprotein LTP in conveying information about dietary lipid composition to the brain to regulate Insulin signaling. When yeast lipids are present in the diet, free calcium levels rise in Blood Brain Barrier glial cells. This induces transport of LTP across the Blood Brain Barrier by two LDL receptor-related proteins: LRP1 and Megalin. LTP accumulates on specific neurons that connect to cells that produce Insulin-like peptides, and induces their release into the circulation. This increases systemic Insulin signaling and the rate of larval development on yeast-containing food compared with a plant-based food of similar nutritional content.

Keywords: D. melanogaster; blood brain barrier; developmental biology; insulin; lipoprotein; neuroscience; stem cells.


Conflict of interest statement

The authors declare that no competing interests exist.

Figures

Figure 1.
Figure 1.. Circulating LTP crosses the BBB and accumulates on neurons.
(A) Confocal section of the CNS from a wt larva reared on YF (wtYF), at the level of the big commissure, stained for LTP (green) and Elav (magenta). (A′A′″). Magnified boxed region in (A) (BB′) Total numbers of LTP-positive neurons/brain lobe (B) or Repo-positive glia/brain (B′) of wtYF larvae of different ages, quantified from 50–60 confocal sections per brain. Numbers indicate larval instar; superscripts indicate age in hours after egg collection. (CE) Cartoons depict positions of all LTP-positive neurons (black dots) identified in confocal stack of three wtYF brains of different ages, stained for LTP and Elav. (F) Western blot showing equal volumes of hemolymph from controlYF larvae, and larvae with FB-specific knock-down of ltp (ltpRNAiFB). Blots are probed for Apo-LTPI, Apo-LTPII, Apo-LPPII and Cv-D. (G and G′) Total numbers of LTP-positive neurons/brain lobe (G) and Repo-positive glia/brain (G′) quantified from controlYF larvae, and larvae where ltp has been knocked-down in neurons (ltpRNAiN), glia (ltpRNAiG), or FB (ltpRNAiFB). Error bars indicate standard deviation. *** = p < 0.001, ** = p < 0.01, n.s. = not significant (Student's t test). Scale bars indicate 50 μm (A and CE) or 5 μm (A′A′″). DOI: http://dx.doi.org/10.7554/eLife.02862.003
Figure 1—figure supplement 1.
Figure 1—figure supplement 1.. Numbers of LTP positive neurons rise over larval development.
Panel shows numbers (see also Figure 1B,B′) of LTP positive neurons/brain hemisphere (red) and Repo positive glia/brain (blue) from staged First, second, early and mid third instar (3rd-72h = 72 hr and 3rd-96h = 96 hr after egg collection) wt larvae. DOI: http://dx.doi.org/10.7554/eLife.02862.004
Figure 1—figure supplement 2.
Figure 1—figure supplement 2.. Small glial subsets enrich LTP positive.
(AB′″) Confocal section at the big commissure from wt (AA′″) or ltp (BB′″) staged larval brains probed for Repo (magenta) and LTP (green). Boxed regions (A′ and B′) enlarged in (A″A″″) and (B″B″″) respectively. Scale bars indicate 50 μm (AB′) and 5 μm (A′″ and B′″). DOI: http://dx.doi.org/10.7554/eLife.02862.005
Figure 1—figure supplement 3.
Figure 1—figure supplement 3.. Circulating LTP crosses the BBB and enriches on neurons.
Panel shows numbers (see also Figure 1G,G’) of LTP positive neurons/brain hemisphere (red) and Repo positive glia/brain (blue) from ltpRNAi/+ (controls) and larvae upon LTP knock-down in neurons (ltpRNAiN), glia (ltpRNAiG) and fat bodies (ltpRNAiFB). Larvae reared on yeast food, superscript numbers indicate standard deviation values. DOI: http://dx.doi.org/10.7554/eLife.02862.006
Figure 2.
Figure 2.. LTP accumulates on neurons positive for Dilp2 and IMPL2.
Confocal sections at the level of (AA′″) or dorsal to (BB′″) the big commissure from third instar wtYF larval brains stained for Dilp2 (magenta) and LTP (green). Boxed regions show LTP/Dilp2 double-positive neurons. Scale bar = 50 μm (A and B) or 5 μm (A′″ and B′″). (C) Cartoon drawn from a single sectioned brain showing positions of IPCs (magenta), IMPL2-producing cells that recruit Dilp2 (DRNs) (grey with magenta rim), and IMPL2-producing cells negative for Dilp2 (grey). LTP (green dots) is found on a subset of DRNs. (D) shows average number of neurons double-positive for Dilp2/IMPL2 (DRNs, grey) and the number of these that are LTP-positive (black) in larval brains of different stages. Error bars = standard deviation. DOI: http://dx.doi.org/10.7554/eLife.02862.013
Figure 2—figure supplement 1.
Figure 2—figure supplement 1.. A small subset of Dilp2 positive neurons expresses IMPL2.
(A-D’’’) 40 μm confocal stack projections from wt (A), dilp2 (B), impL2>cherryTM (C–C’’’) and dilp2>cherryTM (D–D’’’) larval brains probed for Dilp2 (green) and Cherry™ (magenta). Boxed sections (C,D) magnified in C’-C’’’ or D’-D’’’ respectively. Cherry™ shown in C’,D’ and Dilp2 in C’’,D’’. Scale bars = 50 μm (A-D) or 5 μm (C’’’,D’’’). DOI: http://dx.doi.org/10.7554/eLife.02862.014
Figure 2—figure supplement 2.
Figure 2—figure supplement 2.. In the last larval developmental stage DRNs enrich LTP.
Panel shows numbers (see also Figure 2D) of DRNs (grey) and LTP positive DRNs (dark grey) from 1st, 2nd or early and mid 3rd instar (3rd−72h = 72hr and 3rd−96h = 96 hr after egg collection) larvae reared on yeast food. DOI: http://dx.doi.org/10.7554/eLife.02862.015
Figure 3.
Figure 3.. Neuronal LTP accumulation is diet-dependent.
(AE′) Confocal stack projections of fat bodies from early third instar larvae raised on GF (A and A′), LDF (B and B′), LDSF (C and C′), PF (D and D′) and YF (E and E′) probed for FOXO (AE and AE′ magenta) and DAPI (A′E′, green). Scale bars = 20 μm. (FF′″) average number of LTP-positive neurons/brain lobe (F), glial cells/brain (F′) and LTP-positive DRNs (F″) in brains of larvae transferred from YF to indicated diets in the late second instar. Error bars indicate standard deviation. T-test significance: **p < 0.01, ***p < 0.001. (G) Equal hemolymph volumes from wt larvae raised on indicated food sources Western blotted and probed for the indicated Apolipoproteins. DOI: http://dx.doi.org/10.7554/eLife.02862.016
Figure 3—figure supplement 1.
Figure 3—figure supplement 1.. Only yeast food promotes LTP enrichments on DRNs.
Panel shows numbers (see also Figure 3F–F’’) of LTP positive neurons/brain hemisphere (red) and Repo positive glia/brain (blue), and DRNs/brain (light grey) or LTP positive DRNs/brain (dark grey) from wt larvae reared on YF till late 2nd instar and transferred for 16hr on GF, LD, LDS, PF or YF. p-values (Students t’test) are indicated, superscript numbers = standard deviation. DOI: http://dx.doi.org/10.7554/eLife.02862.017
Figure 3—figure supplement 2.
Figure 3—figure supplement 2.. LTP enrichments on DRNs are reversible.
Panel shows numbers (see also Figure 1—figure supplement 3A,A′,C) of LTP positive neurons/brain hemisphere (red) and Repo positive glia/brain (blue), and DRNs/brain (light grey) or LTP positive DRNs/brain (dark grey) from larvae reared on YF, PF, larva reared on PF till late 2nd instar and transferred on YF and larva reared till late 2nd instar on YF and transferred on PF. p-values (Students t’test) are indicated, superscript numbers = standard deviation. DOI: http://dx.doi.org/10.7554/eLife.02862.018
Figure 4.
Figure 4.. Yeast food promotes fast larval development but reduces average life span.
(A, A′, C) Charts depict LTP positive neurons/brain hemisphere (A) and Repo positive glia/brain (A′), and DRNs or LTP positive DRNs/brain (C) from larvae reared on YF, PF, raised on PF till late second instar and transferred for 16hr on YF, and raised on YF till late second instar and transferred for 16 hr on PF. p-values (Student's ttest) are indicated, * = p < 0.05, ** = p < 0.01, n.s. = not significant, error bars = standard deviation. (B) Equal volumes hemolymph from early third instar wt larvae reared on YF or PF probed for Apo-LTP, Apo-LPP and Cvd. (D, E, G) Plotted are percentages (Y-axis) of hatched embryos (D; nYF = 198, nPF = 198; parental flies kept for three generations on respective food types before embryo collection), pupariated larvae (E; nYF = 163 and nPF = 133; time of pupal development was unchanged) and of living mated females (G; nYF = 40 and nPF = 35) over time (X-axis). Please note, LD50 indicated with grey line (G). (FF″) Exemplary photographs of staged wt larvae bred on YF (left) or PF (right). Hours after egg collection (AEC) are indicated in top right corner. DOI: http://dx.doi.org/10.7554/eLife.02862.019
Figure 5.
Figure 5.. Yeast food components activate IPCs to release Dilp2 and induce systemic Insulin signaling.
(AD) show GFP fluorescence from collapsed confocal stacks of whole brains expressing GCaMP under the control of rab3-GAL4 (A and B) or dilp2-GAL4 (C and D) from larvae reared on YF (A and C) or PF (B and D). (E) Hemolymph blots probed for Dilp2 and CvD from wild type (lanes 1 and 3), dilp2 mutant (lane 2) and repo-GAL4>lrp1,2RNAi (lane 4) larvae reared on yeast food (YF) or plant food (PF) as indicated. (F and G) show single confocal sections of salivary glands expressing the PIP3 reporter PHGFP under the direct control of the tubulin promoter. Larvae were reared on YF (F) or PF (G). (H) Western blots from fat body lysates probed for phospho-AKT, LTP and CvD as indicated. Lysates are from wild type (lanes 1, 2), repo-GAL4>lrp1,2RNAi (lane 3), lpp-GAL4>ltpRNAi (lane4) and YFP-rab27;YFP-rab3;impl2-GAL4>gfpRNAi (lane 5). Larvae were reared on yeast food (YF) or plant food (PF) as indicated. (I) shows percentages of larvae that have pupariated at different days after egg laying (dAEL). Larvae were reared on yeast food (red, n = 49), on plant food (black, n = 34), or on lipid-depleted food supplemented with either yeast lipids (light red, n = 23) or plant lipids (grey, n = 24). (J and K) show GFP fluorescence from collapsed confocal stacks of whole brains expressing GCaMP under the control of dilp2-GAL4 from larvae fed on lipid-depleted food supplemented with yeast lipids (J) or lipid-depleted food supplemented with plant lipids (K). See also Videos 7 and 8. DOI: http://dx.doi.org/10.7554/eLife.02862.020
Figure 6.
Figure 6.. IPC and IMPL2-positive neurons are in direct contact.
(A) Projected confocal stacks of an early third instar brain expressing transmembrane Cherry under the control of dilp2-GAL4, stained for Cherry (green) and Dilp2 (magenta). Most Dilp2 is detected in projections that terminate in the periphery (as determined from examining individual sections). However, Cherry staining reveals other projections that enter the central neuropil (Linneweber et al., 2014) or remain in other regions of the CNS (Levin et al., 2011; Bjordal et al., 2014). (B) Shows a single confocal section from impl2-GAL4>cherryTM larval brains probed for Dilp2 (B, green in B′″), Cherry (B′, red in B′″) and IMPL2 (B″, blue in B′″). White arrows point to colocalization between Dilp2 and IMPL2. Scale bars indicate 50 µm (A) or 10 µm (BB′″). (C) Shows percentages of yeast food-reared larvae of different genotypes that have pupariated at different days after egg laying (dAEL). Black indicates pooled results from two control genotypes: UAS:lrp1,2RNAi/+ and UAS:gfpRNAi/+ (n = 81). Red indicates repo-GAL4>lrp1,2RNAi (n = 109). Light grey indicates YFP-rab27;YFP-rab3;impl2-GAL4>gfpRNAi (n = 76). Dark grey indicates YFP-rab27;YFP-rab3;dilp2-GAL4>gfpRNAi (n = 120). DOI: http://dx.doi.org/10.7554/eLife.02862.023
Figure 6—figure supplement 1.
Figure 6—figure supplement 1.. Y-rab3 and Yrab27 are reduced by gfpRNAi.
(A,B) show confocal sections at the level of the big brain commissure from control YFPrab27;YFPrab3;UAS:gfpRNAi (A) and YFPrab27;YFPrab3;rab3Gal4> UAS:gfpRNAi (B) larval brains. Scale bars indicate 50 µm. DOI: http://dx.doi.org/10.7554/eLife.02862.024
Figure 7.
Figure 7.. Glial LRP1 and LRP2 receptors move LTP across the BBB.
(AF) Confocal brain sections at the level of the big commissure stained for LRP1 (AC) or LRP2 (DF) from controlYF larvae (A and D) or larvae with neuronal (B and E) or glial (C and F) knock-down of each receptor. Glial knock down reduces LRP1 and LRP2. (GG′″) Average number of LTP-positive neurons/brain lobe (G) Repo-positive glia/brain (G′) or fraction of LTP-positive DRNs (G′″) in larval brains with glial knock-down of LRP1 and LRP2 singly or in combination, as indicated. Error bars indicate standard deviation. T-test significance: *p = 0.052, **p > 0.01, ***p < 0.001. (HH″) control larvae (right) and larvae with glial knock-down of both LRP1/LRP2 (left) photographed at indicated times after egg collection. (I) Percent of control (n = 216, black) or double LRP1/LRP2 knock down (n = 183, red) larvae pupariating over time. (JL′) Confocal stack projections of fat bodies from control (J and J′), fat body (K and K′) or glial (L and L′) LRP1,2 knock down larvae stained for FOXO (magenta) and DAPI (green). Scale bars = 20 μm. (M) Percent survival of control (n = 34, black) or glial LRP1/2 double knock-down (n = 33, red) flies fed with YF; grey line indicates 50% survival. DOI: http://dx.doi.org/10.7554/eLife.02862.025
Figure 7—figure supplement 1.
Figure 7—figure supplement 1.. Neuronal LTP enrichments are reduced in lrp1,2.
(A,A’) Charts show LTP positive neurons/brain hemisphere (A) and Repo positive glia/brain (A’) from wt, lpr1,2 and lrp1,2 larva reared on YF. * = p < 0.05, *** = p < 0.001 (Students t’test), error bars = standard deviation. (B) Equal volumes hemolymph probed for Apo-LTP, Apo-LPP and CvD. Please note increased LTP levels present in lpr1,2 hemolymph (arrowhead). DOI: http://dx.doi.org/10.7554/eLife.02862.026
Figure 7—figure supplement 2.
Figure 7—figure supplement 2.. Neuronal LTP enrichments are only mildly affected in lpr1,2.
Panel shows numbers of LTP positive neurons/brain hemisphere (red) and Repo positive glia/brain (blue) from staged wt, lrp1,2 and lpr1,2 larvae reared on YF. Superscript numbers = standard deviation, p-values (Students t’test) are indicated. DOI: http://dx.doi.org/10.7554/eLife.02862.027
Figure 7—figure supplement 3.
Figure 7—figure supplement 3.. Both receptors, LRP1 and LRP2, promote LTP transport in glia.
Panel shows numbers (see also Figure 4G–G’’) of LTP positive neurons/brain hemisphere (red) and Repo positive glia/brain (blue), and DRNs/brain (light grey) or LTP positive DRNs/brain (dark grey) from lrp1,2RNAi/+ (controls) and larvae upon glial knock-down of LRP1 (lrp1RNAiG) , LRP2 (lrp2RNAiG), and LRP1,2 (lrp1,2RNAiG) protein. Larvae reared on YF, p-values (Students t’test) are indicated, superscript numbers = standard deviation. DOI: http://dx.doi.org/10.7554/eLife.02862.028
Figure 8.
Figure 8.. Increased free Ca++ levels promote systemic Insulin signaling.
(AD) Show GFP fluorescence of the GCaMP reporter construct in confocal sections of larval brains at the level of the big brain commissure. GCaMP was expressed either in all glia under the control of repo-GAL4 (A and B) or in BBB glia under the control of moody-GAL4 (C and D). Larvae were reared on yeast food (A and C) or plant food (B and D). White arrowheads point to blood brain barrier and scale bars indicate 50 µm. (E) shows the average number of LTP-positive neurons per brain lobe (E, red, n = 10) or the average number neurons co-staining for LTP and Dilp2 (DRNs) (E′, grey, n = 5) from either UAS:trpa1 (control) larvae or larvae expressing TRPA1 under the control of moody-GAL4 (TRPA1BBB). All larvae were reared on plant food at 29C. Error bars show standard deviations. * indicates p < 0.02, *** indicates p < 0.0002. (F) Western blot of fat body lysates from control (UAS:trpa1/+) larvae (lane 1) or larvae expressing TRPA1 in BBB glia under the control of moody-GAL4 (lane 2), probed for phospho-AKT1 and CvD. Larvae were all reared on plant food (PF). DOI: http://dx.doi.org/10.7554/eLife.02862.029

References

    1. Abbott NJ, Patabendige AA, Dolman DE, Yusof SR, Begley DJ. 2010. Structure and function of the blood-brain barrier. Neurobiology of Disease 37:13. doi: 10.1016/j.nbd.2009.07.030 - DOI - PubMed
    1. Bader R, Sarraf-Zadeh L, Peters M, Moderau N, Stocker H, Köhler K, Pankratz MJ, Hafen E. 2013. The IGFBP7 homolog Imp-L2 promotes insulin signaling in distinct neurons of the Drosophila brain. Journal of Cell Science 126:2571–2576. doi: 10.1242/jcs.120261 - DOI - PubMed
    1. Bjordal M, Arquier N, Kniazeff J, Pin JP, Leopold P. 2014. Sensing of amino acids in a dopaminergic circuitry promotes rejection of an incomplete diet in Drosophila. Cell 156:510. doi: 10.1016/j.cell.2013.12.024 - DOI - PubMed
    1. Brankatschk M, Eaton S. 2010. Lipoprotein particles cross the blood-brain barrier in Drosophila. The Journal of Neuroscience 30:10441–10447. doi: 10.1523/JNEUROSCI.5943-09.2010 - DOI - PMC - PubMed
    1. Broughton SJ, Piper MD, Ikeya T, Bass TM, Jacobson J, Driege Y, Martinez P, Hafen E, Withers DJ, Leevers SJ, Partridge L. 2005. Longer lifespan, altered metabolism, and stress resistance in Drosophila from ablation of cells making insulin-like ligands. Proceedings of the National Academy of Sciences of USA 102:3105–3110. doi: 10.1073/pnas.0405775102 - DOI - PMC - PubMed

Publication types

MeSH terms

LinkOut - more resources