

LINE-1 hypomethylation in blood and tissue samples as an epigenetic marker for cancer risk: a systematic review and meta-analysis
- PMID: 25275447
- PMCID: PMC4183594
- DOI: 10.1371/journal.pone.0109478
LINE-1 hypomethylation in blood and tissue samples as an epigenetic marker for cancer risk: a systematic review and meta-analysis
Abstract
Objective: A systematic review and a meta-analysis were carried out in order to summarize the current published studies and to evaluate LINE-1 hypomethylation in blood and other tissues as an epigenetic marker for cancer risk.
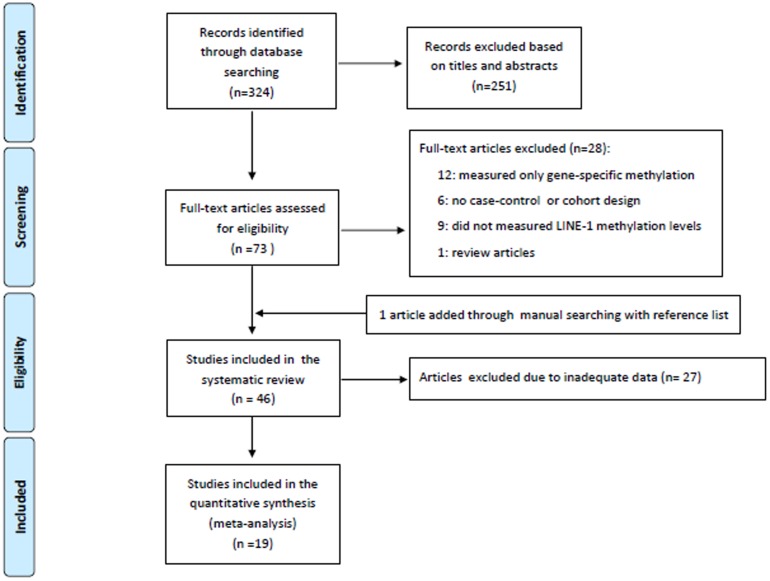
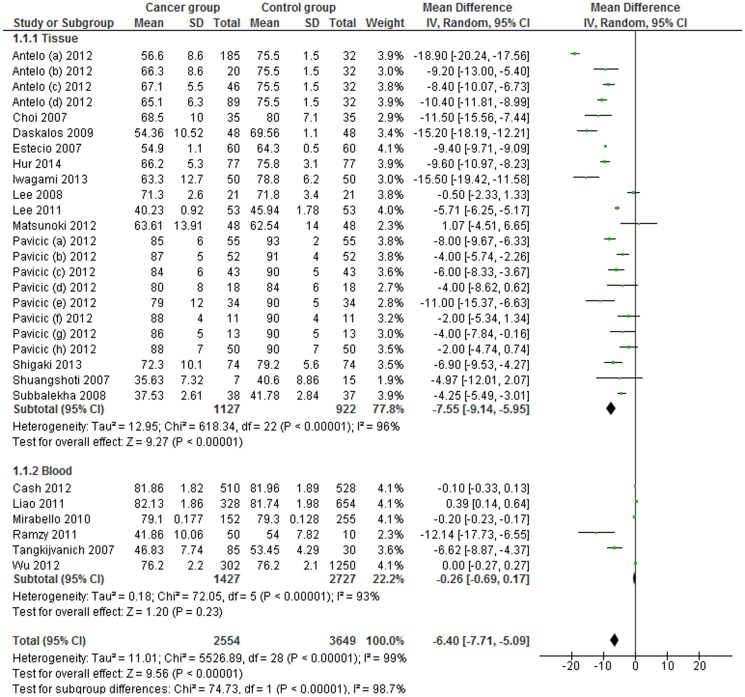
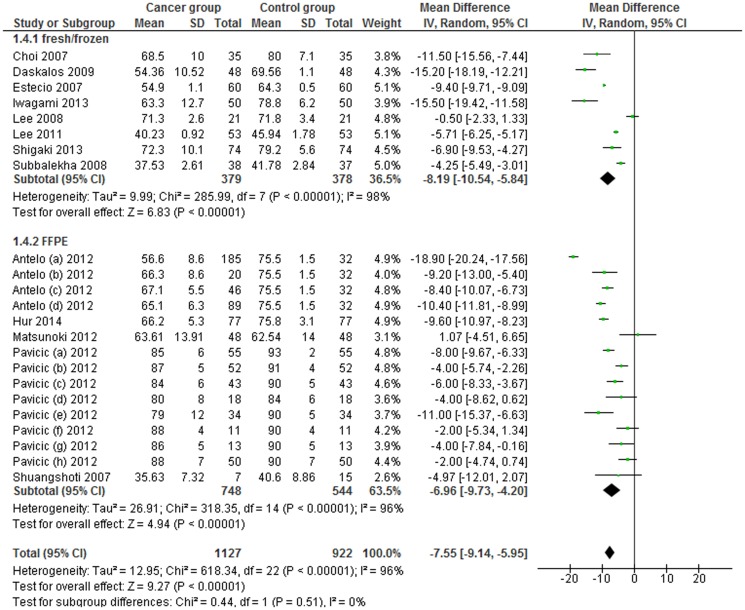
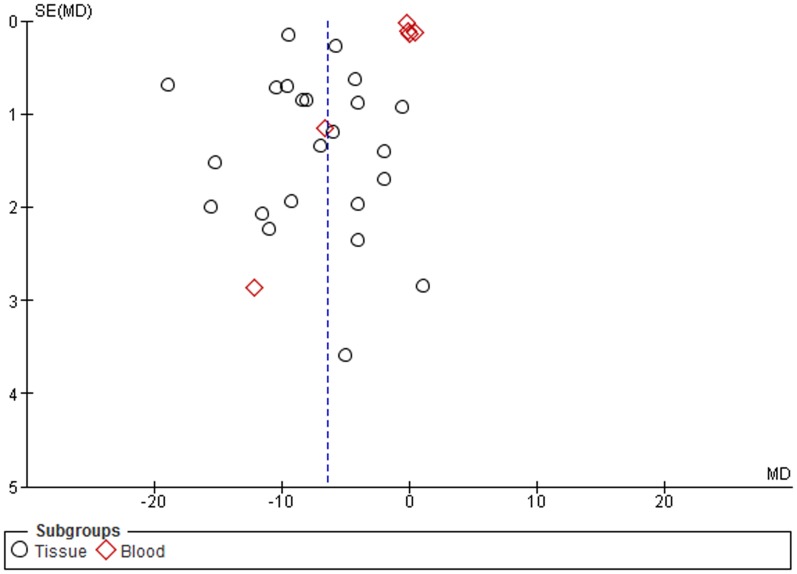
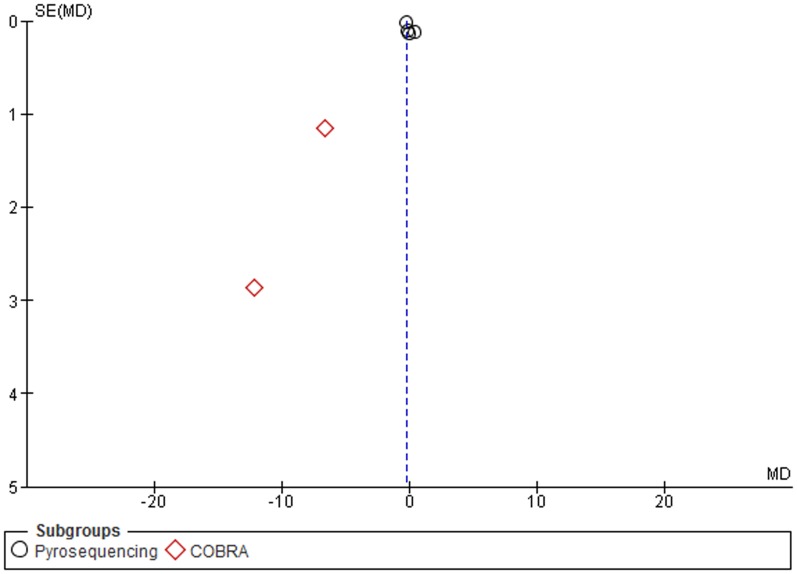
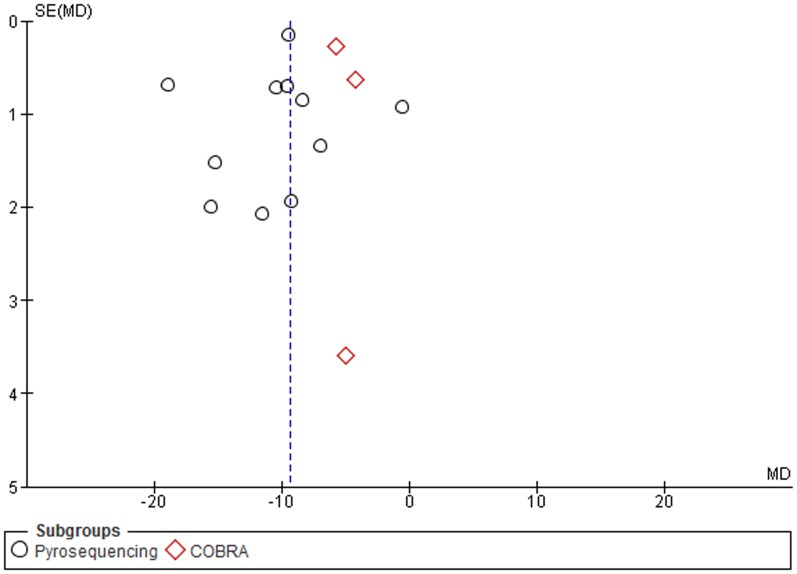
Methods: A systematic literature search in the Medline database, using PubMed, was conducted for epidemiological studies, published before March 2014. The random-effects model was used to estimate weighted mean differences (MDs) with 95% Confidence Intervals (CIs). Furthermore, subgroup analyses were conducted by sample type (tissue or blood samples), cancer types, and by assays used to measure global DNA methylation levels. The Cochrane software package Review Manager 5.2 was used.
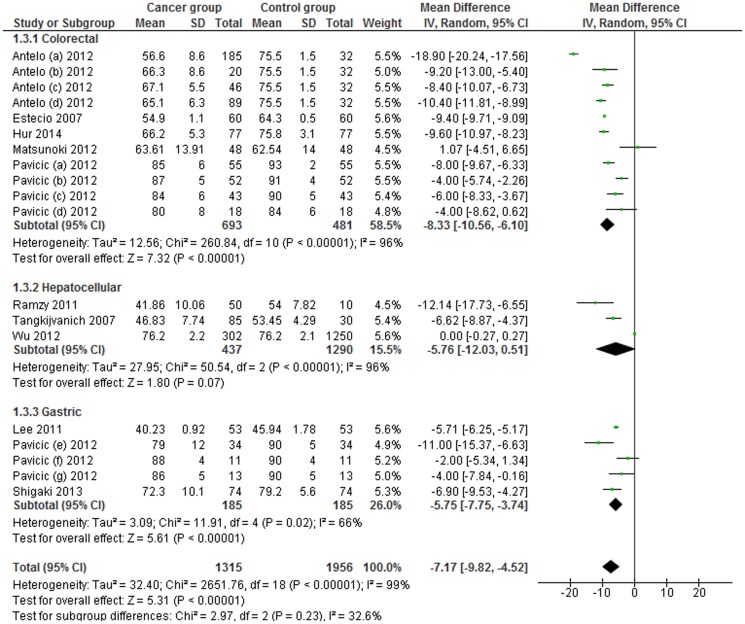
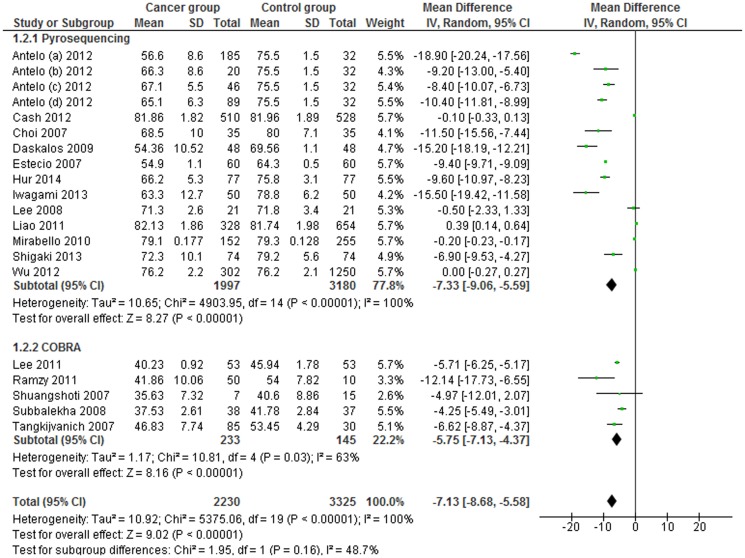
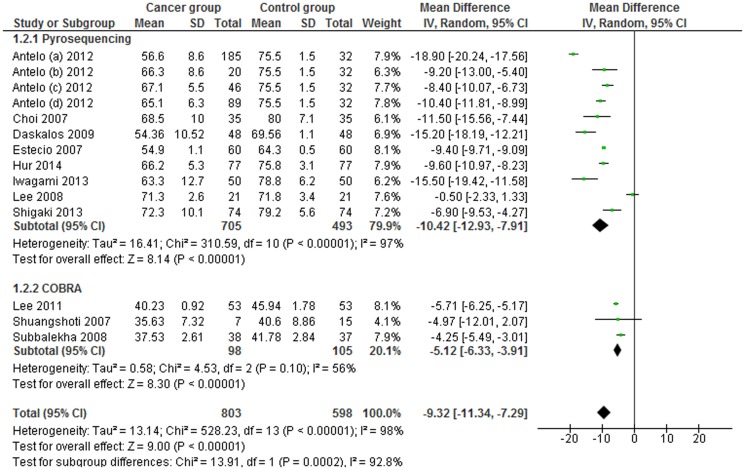
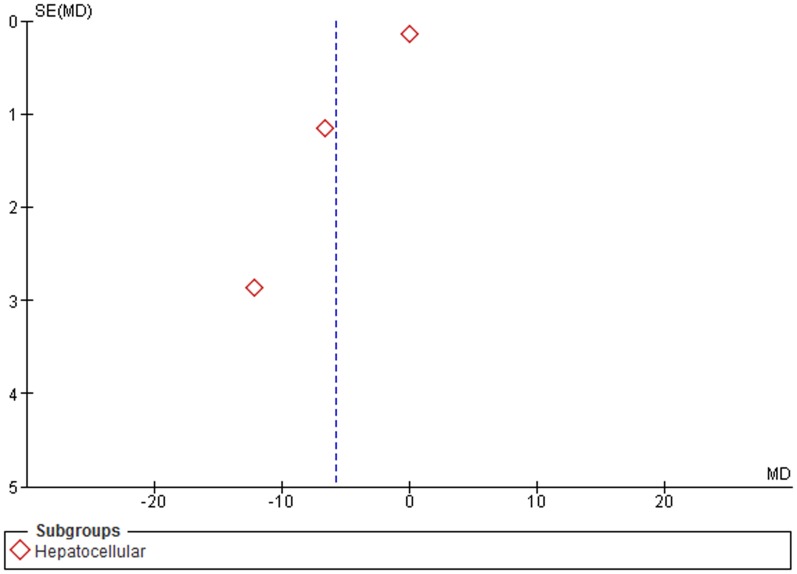
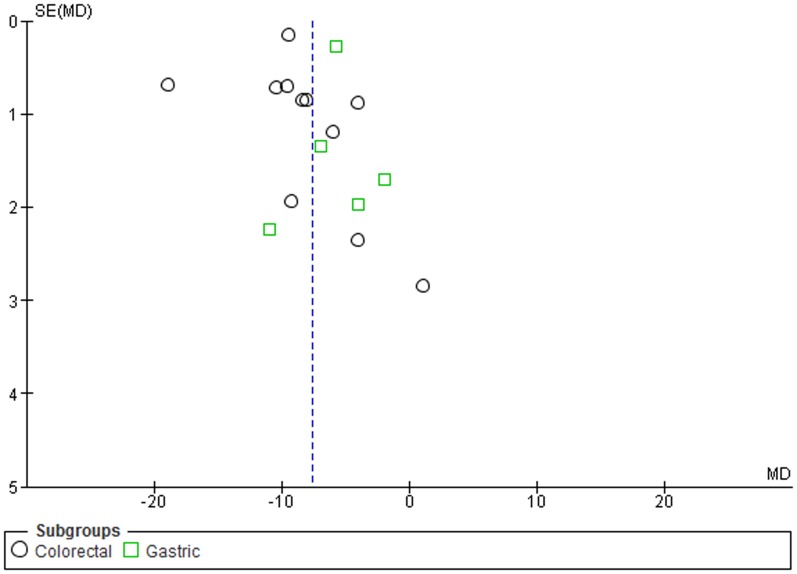
Results: A total of 19 unique articles on 6107 samples (2554 from cancer patients and 3553 control samples) were included in the meta-analysis. LINE-1 methylation levels were significantly lower in cancer patients than in controls (MD: -6.40, 95% CI: -7.71, -5.09; p<0.001). The significant difference in methylation levels was confirmed in tissue samples (MD -7.55; 95% CI: -9.14, -65.95; p<0.001), but not in blood samples (MD: -0.26, 95% CI: -0.69, 0.17; p = 0.23). LINE-1 methylation levels were significantly lower in colorectal and gastric cancer patients than in controls (MD: -8.33; 95% CI: -10.56, -6.10; p<0.001 and MD: -5.75; 95% CI: -7.75, -3.74; p<0.001) whereas, no significant difference was observed for hepatocellular cancer.
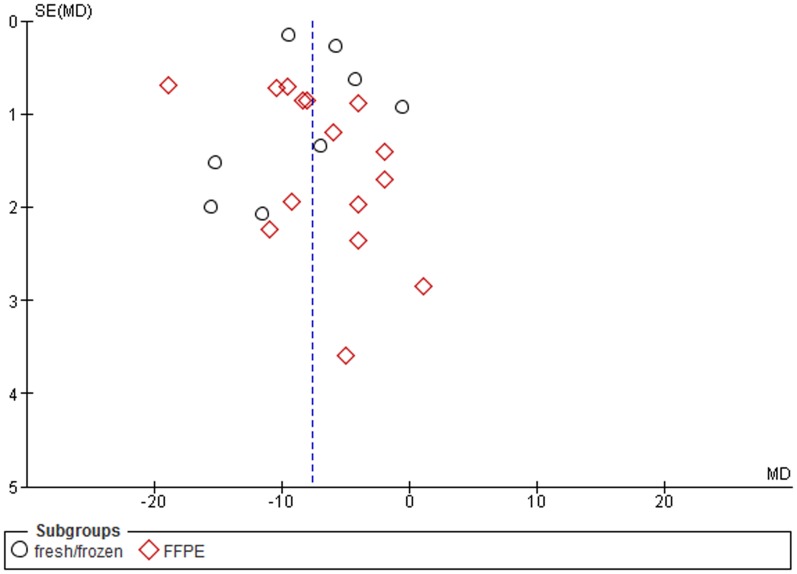
Conclusions: The present meta-analysis adds new evidence to the growing literature on the role of LINE-1 hypomethylation in human cancer and demonstrates that LINE-1 methylation levels were significantly lower in cancer patients than in control samples, especially in certain cancer types. This result was confirmed in tissue samples, both fresh/frozen or FFPE specimens, but not in blood. Further studies are needed to better clarify the role of LINE-1 methylation in specific subgroups, considering both cancer and sample type, and the methods of measurement.
Conflict of interest statement
Figures
References
-
- Laird PW, Jaenisch R (1994) DNA methylation and cancer. Hum Mol Genet 3: 1487–1496. - PubMed
-
- Jones PA (1996) DNA methylation errors and cancer. Cancer Res 56: 2463–2467. - PubMed
-
- Liu L, Wylie RC, Andrews LG, Tollefsbol TO (2003) Aging, cancer and nutrition: the DNA methylation connection. Mech Ageing Dev 124: 989–998. - PubMed
-
- Davis CD, Uthus EO (2004) DNA methylation, cancer susceptibility, and nutrient interactions. Exp Biol Med 229: 988–995. - PubMed
Publication types
MeSH terms
Substances
LinkOut - more resources
Full Text Sources
Other Literature Sources
Research Materials
Miscellaneous
