. 2014 Oct 2;9(9):e109054.
doi: 10.1371/journal.pone.0109054. eCollection 2014.

Photosynthetic diffusional constraints affect yield in drought stressed rice cultivars during flowering

Affiliations

Photosynthetic diffusional constraints affect yield in drought stressed rice cultivars during flowering

Marco Lauteri et al. PLoS One. .

Erratum in

Abstract

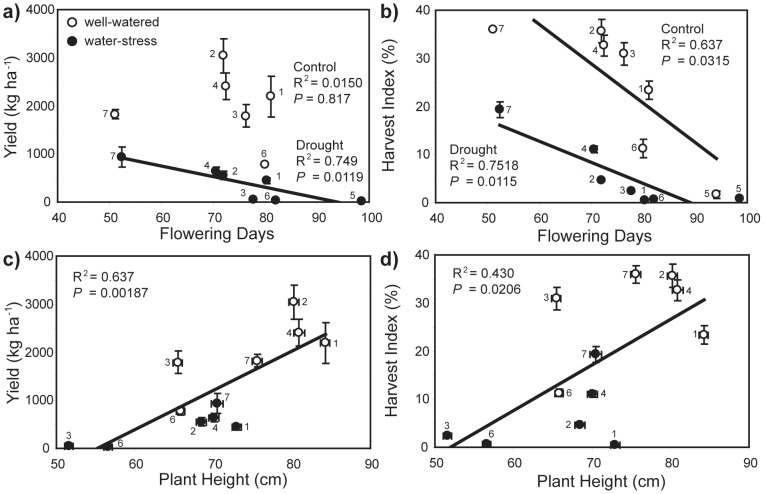
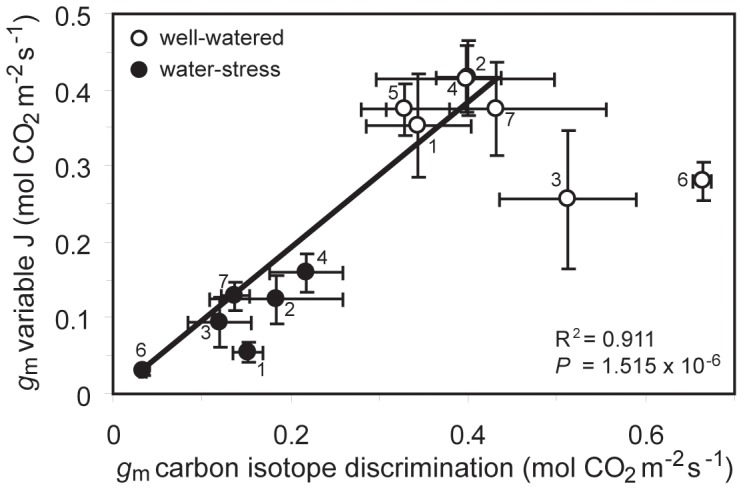
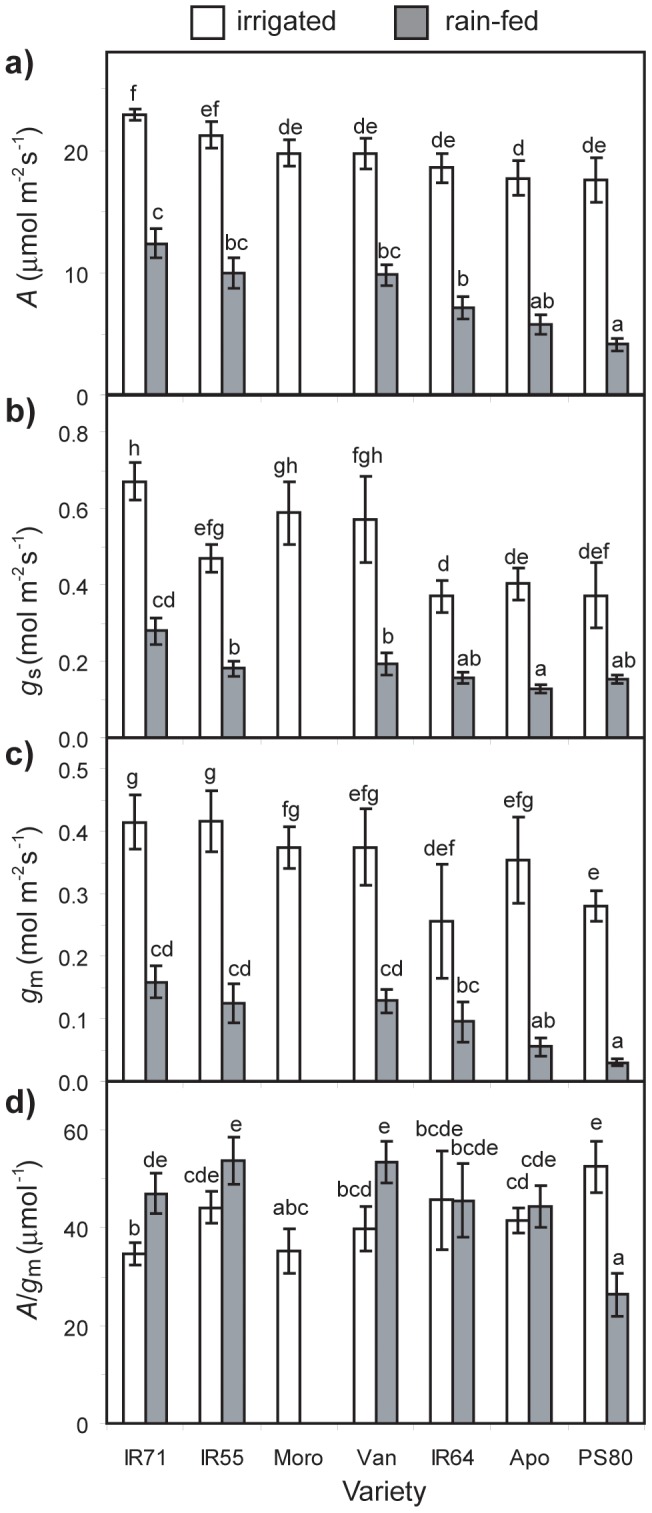
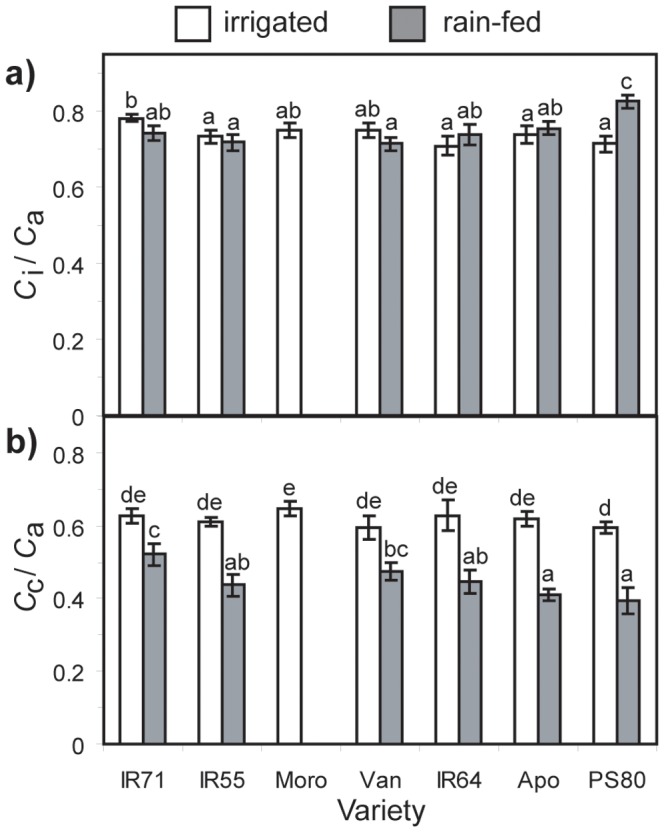
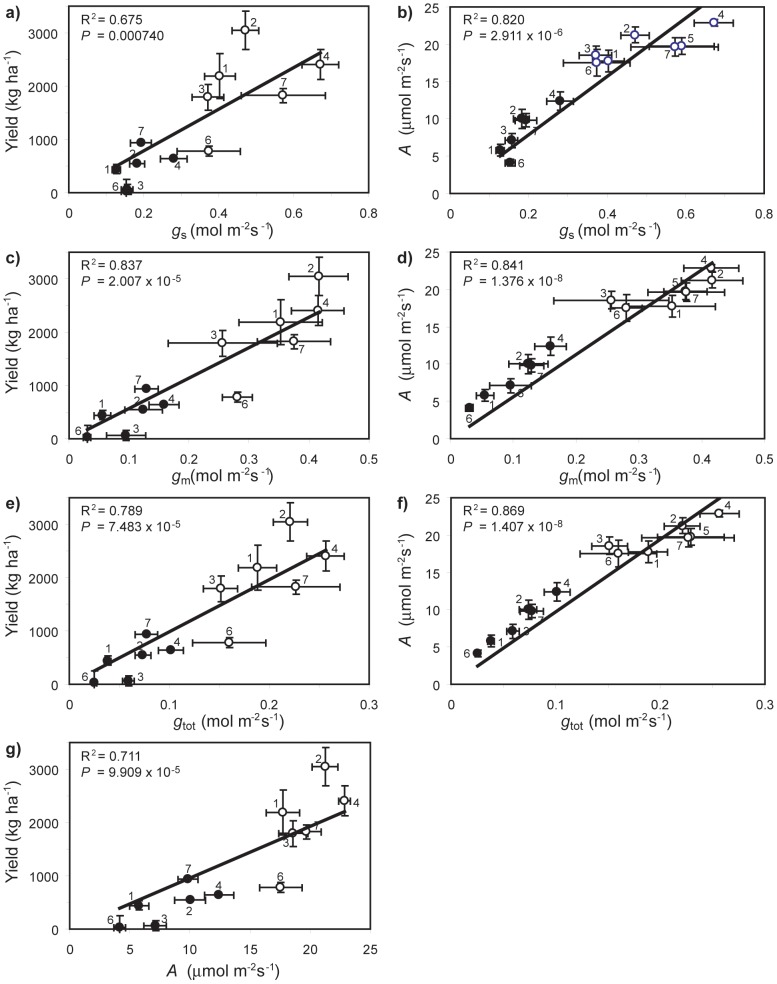
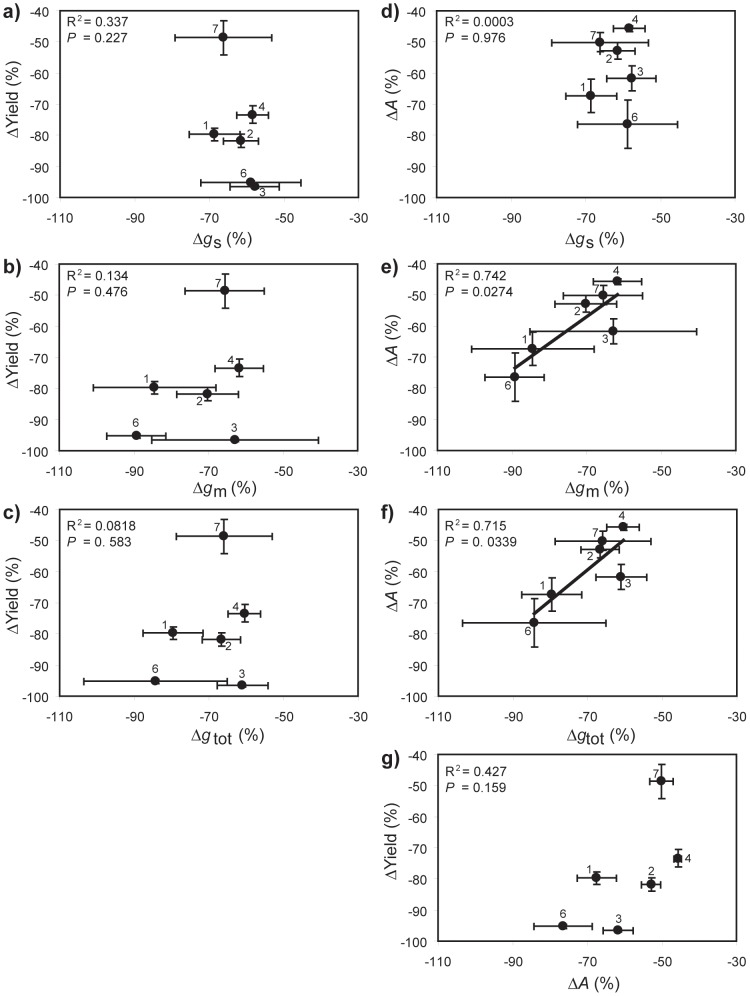
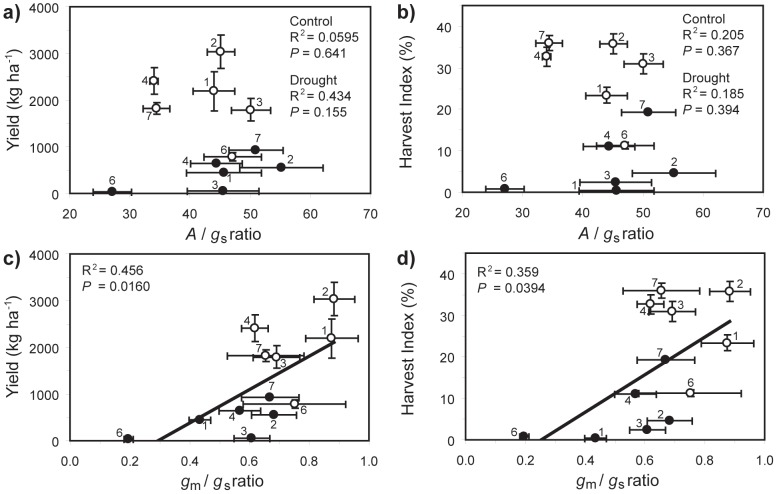
Global production of rice (Oryza sativa) grain is limited by water availability and the low 'leaf-level' photosynthetic capacity of many cultivars. Oryza sativa is extremely susceptible to water-deficits; therefore, predicted increases in the frequency and duration of drought events, combined with future rises in global temperatures and food demand, necessitate the development of more productive and drought tolerant cultivars. We investigated the underlying physiological, isotopic and morphological responses to water-deficit in seven common varieties of O. sativa, subjected to prolonged drought of varying intensities, for phenotyping purposes in open field conditions. Significant variation was observed in leaf-level photosynthesis rates (A) under both water treatments. Yield and A were influenced by the conductance of the mesophyll layer to CO2 (g(m)) and not by stomatal conductance (g(s)). Mesophyll conductance declined during drought to differing extents among the cultivars; those varieties that maintained g(m) during water-deficit sustained A and yield to a greater extent. However, the variety with the highest g(m) and yield under well-watered conditions (IR55419-04) was distinct from the most effective cultivar under drought (Vandana). Mesophyll conductance most effectively characterises the photosynthetic capacity and yield of O. sativa cultivars under both well-watered and water-deficit conditions; however, the desired attributes of high g(m) during optimal growth conditions and the capacity for g(m) to remain constant during water-deficit may be mutually exclusive. Nonetheless, future genetic and physiological studies aimed at enhancing O. sativa yield and drought stress tolerance should investigate the biochemistry and morphology of the interface between the sub-stomatal pore and mesophyll layer.


Conflict of interest statement

Competing Interests: The authors have declared that no competing interests exist.

Figures

Figure 1
Figure 1. The performance of seven rice varieties under well-watered (open symbols) and drought conditions (closed symbols): a) relationship between yield and flowering days (period of time for 50% of plants to develop flowers) under full-water (linear regression: R2 = 0.0150; F 1,4 = 0.0609; P = 0.817) and drought (linear regression: R2 = 0.749; F 1,5 = 14.905; P = 0.0119); b) allometric relationship between yield and plant height (linear regression: R2 = 0.637; F 1,10 = 17.536; P = 0.00187); c) relationship between harvest index (HI:dry weight of grain relative to dry total plant biomass) and flowering days under full-water (linear regression: R2 = 0.637; F 1,5 = 8.760; P = 0.0315) and drought (linear regression: R2 = 0.752; F 1,5 = 15.144; P = 0.0115), and; d) relationship between HI and plant height (linear regression: R2 = 0.430; F 1,10 = 7.548; P = 0.0206).
Error bars indicate one standard error either side of the mean. Numbers next to data points indicate Oryza sativa variety: 1 = Apo; 2 = IR55; 3 = IR64; 4 = IR71; 5 = Moro; 6 = PSBRc80; 7 = Van.
Figure 2
Figure 2. Comparison between the estimates of mesophyll conductance of CO2 (g m) obtained by applying two independent methods: the variable J method and the ‘δ13C of recently synthesised sugars’ method (linear regression: R2 = 0.932; F 1,9 = 122.750; P = 1.515×10⁻⁶).
Each data point represents the average value of three observations based upon the Δ13C of recently synthesised sugars and six to fourteen gas-exchange measurements utilising the variable J method. Error bars as in Figure 1. The regression line excludes the two data points on the right of the graph (IR64 and PS80) with anomalously high g m derived from the δ13C of recently synthesised sugars. Numbers next to data points indicate Oryza sativa variety as in Figure 1.
Figure 3
Figure 3. Measurements of (a) photosynthesis rate (A), (b) stomatal conductance (g s), (c) mesophyll conductance (g m), and (d) intrinsic transpiration efficiency (A/g s) in control and water-stressed leaves of the seven Oryza sativa genotypes.
The measurements were made on the flag leaf in saturating PPFD (1400 µmol m−2s−1), with relative humidity ranging between 45–55%, and a leaf temperature of 30°C. Data are means of 4 to 7 plants per treatment. Error bars as in Figure 1. Different letters denote significant differences among means derived using a factorial ANOVA and Tukey post-hoc test.
Figure 4
Figure 4. Measurements of (a) the intercellular [CO2] (C i) to the ambient [CO2] (C a) ratio (C i/C a), and (b) the chloroplastic [CO2] (C c) to the ambient [CO2] ratio (C c/C a) in control and water-stressed leaves of the seven Oryza sativa genotypes.
The measurements were made on the flag leaf in saturating PPFD (1400 µmol m−2s−1), with relative humidity ranging between 45–55%, and a leaf temperature of 30°C. Data are means of 4 to 7 plants per treatment. Error bars as in Figure 1. Different letters denote significant differences among means derived using a factorial ANOVA and Tukey post-hoc test.
Figure 5
Figure 5. Interaction of diffusive conductance parameters to CO2 uptake with yield and photosynthesis (A) under well-watered (open symbols) and drought conditions (closed symbols): a) relationship between yield and stomatal conductance (g s) (linear regression: R2 = 0.696; F 1,10 = 22.900; P = 0.000740); b) relationship between A and g s (linear regression: R2 = 0.873; F 1,11 = 75.721; P = 2.911×10⁻⁶); c) relationship between yield and mesophyll conductance (g m) (linear regression: R2 = 0.850; F 1,10 = 56.611; P = 2.911×10⁻⁵); d) relationship between A and g m (linear regression: R2 = 0.952; F 1,11 = 217.071; P = 1.376×10⁻⁸); e) relationship between yield and total conductance (g tot) (linear regression: R2 = 0.806; F 1,10 = 41.418; P = 7.483×10⁻⁵); f) relationship between A and g tot (linear regression: R2 = 0.952; F 1,11 = 216.173; P = 1.407×10⁻⁸), and; g) relationship between yield and A (linear regression: R2 = 0.795; F 1,10 = 38.665; P = 9.909×10⁻⁵).
Error bars as in Figure 1. Numbers next to data points indicate Oryza sativa variety as in Figure 1.
Figure 6
Figure 6. Changes in yield and photosynthesis in relation to modification of diffusive resistances to CO2 uptake following water-stress.
Those varieties that experienced smaller reductions in parameters were more tolerant of drought. a) relationship between Δyield and Δg s (linear regression: R2 = 0.337; F 1,4 = 2.032; P = 0.227); b) relationship between Δyield and Δg m (linear regression: R2 = 0.134; F 1,4 = 0.618; P = 0.476); c) relationship between Δyield and Δg tot (linear regression: R2 = 0.0818; F 1,4 = 0.356; P = 0.583); d) relationship between ΔA and Δg s (linear regression: R2 = 0.0003; F 1,4 = 0.00106; P = 0.976); e) relationship between ΔA and Δg m (linear regression: R2 = 0.742; F 1,4 = 11.527; P = 0.0274); f) relationship between ΔA and Δg tot (linear regression: R2 = 0.715; F 1,4 = 10.042; P = 0.0339), and; g) relationship between Δyield and ΔA (linear regression: R2 = 0.427; F 1,4 = 2.979; P = 0.159). Error bars as in Figure 1. Numbers next to data points indicate Oryza sativa variety as in Figure 1.
Figure 7
Figure 7. Interaction of yield and A with transpiration efficiency (A/g s) and the ratio of g m to g s in well-watered (open symbols) and drought conditions (closed symbols): a) relationship between yield and A/g s under full (linear regression: R2 = 0.0595; F 1,4 = 0.253; P = 0.641) and water-stressed (linear regression: R2 = 0.434; F 1,4 = 3.072; P = 0.155) conditions; b) relationship between harvest index (HI) and A/g s under full (linear regression: R2 = 0.205; F 1,4 = 1.032; P = 0.367) and water-stressed (linear regression: R2 = 0.185; F 1,4 = 0.909; P = 0.394) conditions; c) relationship between yield and g m:g s (linear regression: R2 = 0.456; F 1,10 = 8.379; P = 0.0160), and; d) relationship between HI and g m:g s (linear regression: R2 = 0.359; F 1,10 = 5.610; P = 0.0394).
Error bars as in Figure 1. Numbers next to data points indicate Oryza sativa variety as in Figure 1.

References

    1. Pandey S, Bhandari H, Ding S, Prapertchob P, Sharan R, et al. (2007) Coping with drought in rice farming in Asia: insights from a cross-country comparative study. Agricultural Economics 37: 213–224.
    1. Serraj R, McNally KL, Slamet-Loedin I, Kohli A, Haefele SM, et al. (2011) Drought resistance improvement in rice: an integrated genetic and resource management strategy. Plant Production Science 14: 1–14.
    1. Parent B, Suard B, Serraj R, Tardieu F (2010) Rice leaf growth and water potential are resilient to evaporative demand and soil water deficit once the effects of root system are neutralized. Plant, Cell & Environment 33: 1256–1267. - PubMed
    1. Peng S, Cassman KG, Virmani SS, Sheehy J, Khush GS (1999) Yield potential trends of tropical rice since the release of IR8 and the challenge of increasing rice yield potential. Crop Science 39: 1552–1559.
    1. Hubbart S, Peng S, Horton P, Chen Y, Murchie EH (2007) Trends in leaf photosynthesis in historical rice varieties developed in the Philippines since 1966. Journal of Experimental Botany 58: 3429–3438. - PubMed

Publication types

LinkOut - more resources