Comparative Study
. 2014 Oct 2;5(10):e1440.
doi: 10.1038/cddis.2014.323.

Severe influenza A(H1N1)pdm09 infection induces thymic atrophy through activating innate CD8(+)CD44(hi) T cells by upregulating IFN-γ

Affiliations
Comparative Study

Severe influenza A(H1N1)pdm09 infection induces thymic atrophy through activating innate CD8(+)CD44(hi) T cells by upregulating IFN-γ

B Liu et al. Cell Death Dis. .

Abstract

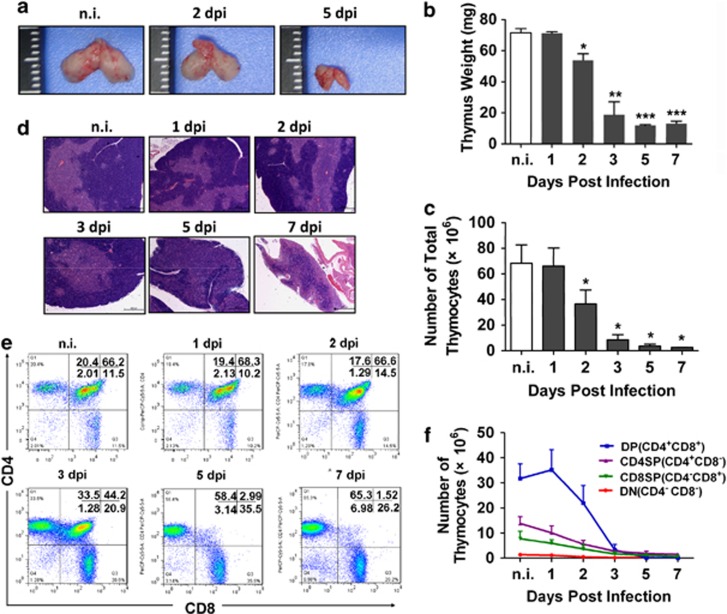
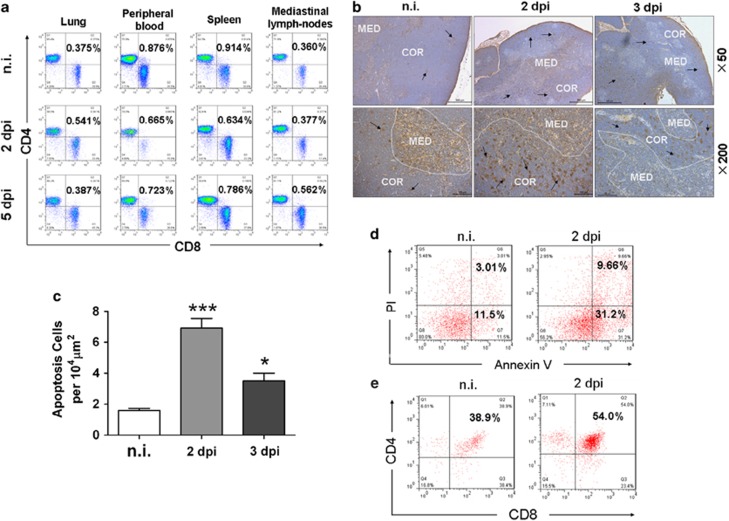
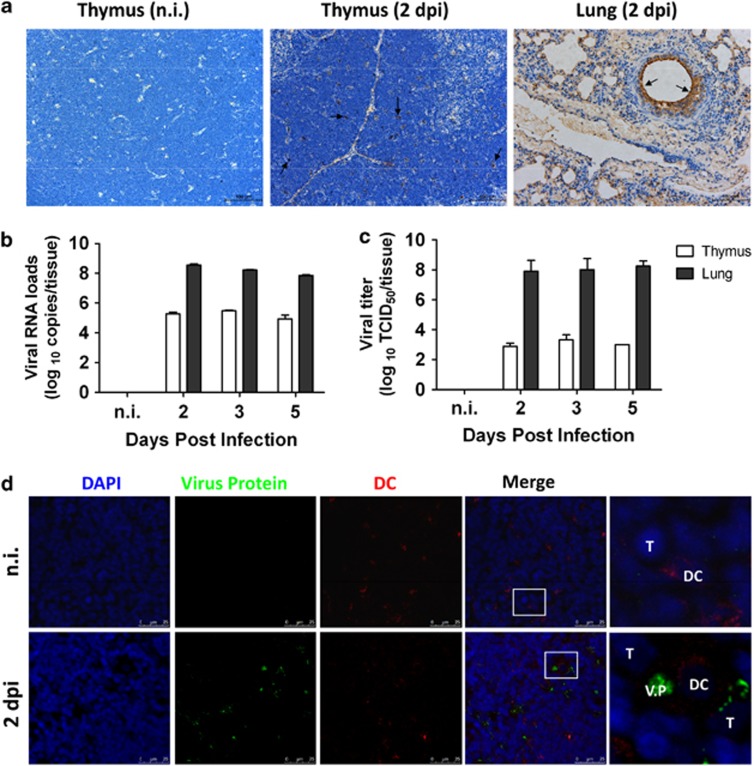
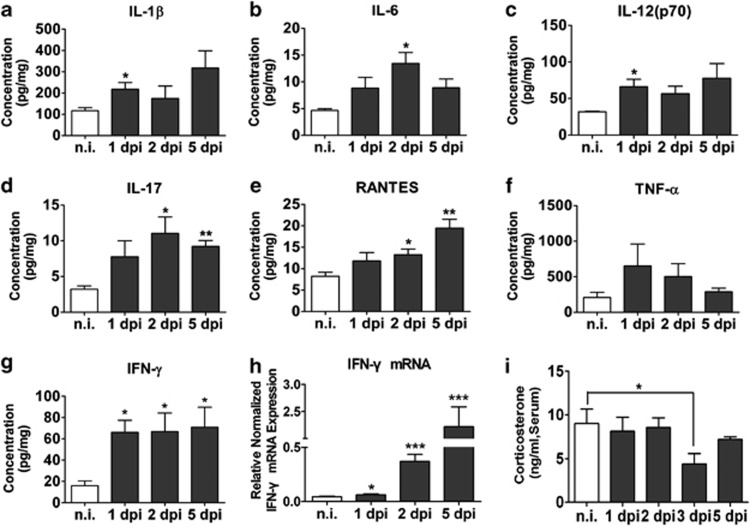
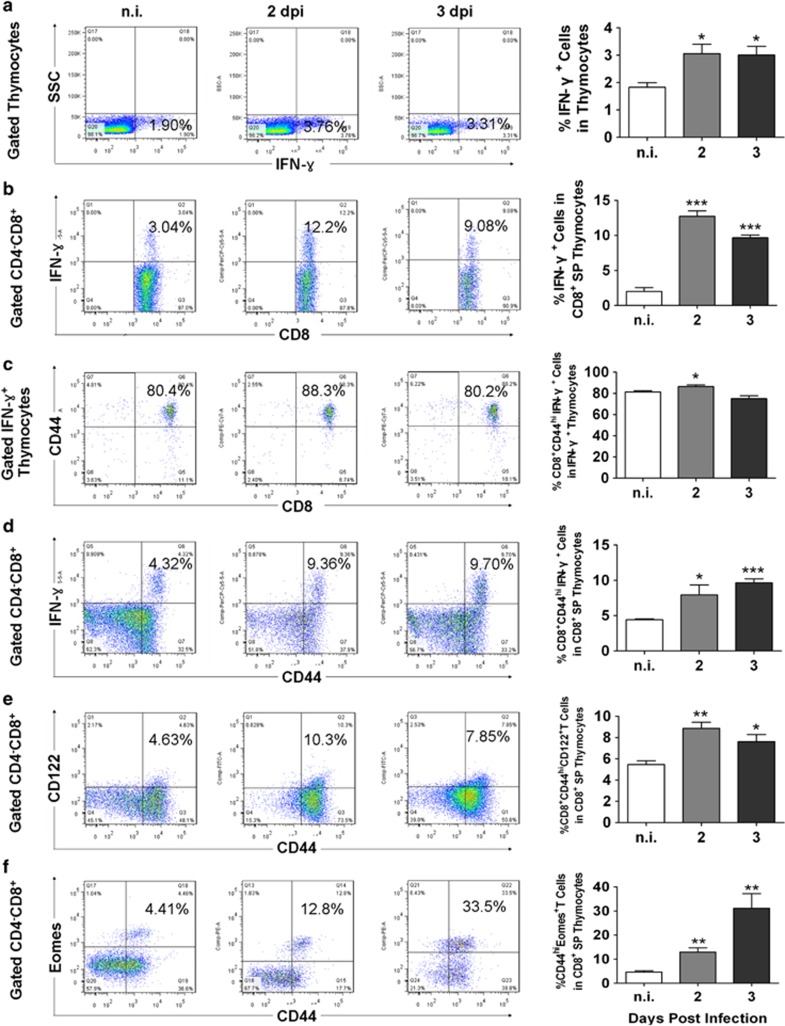
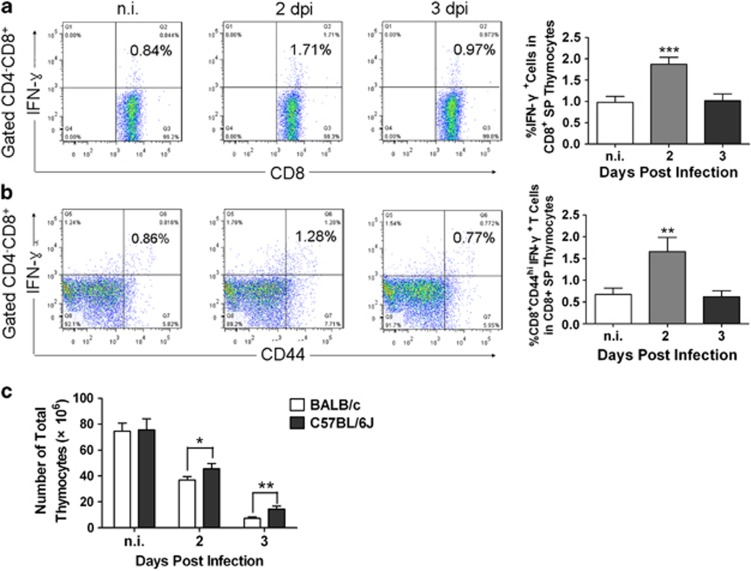
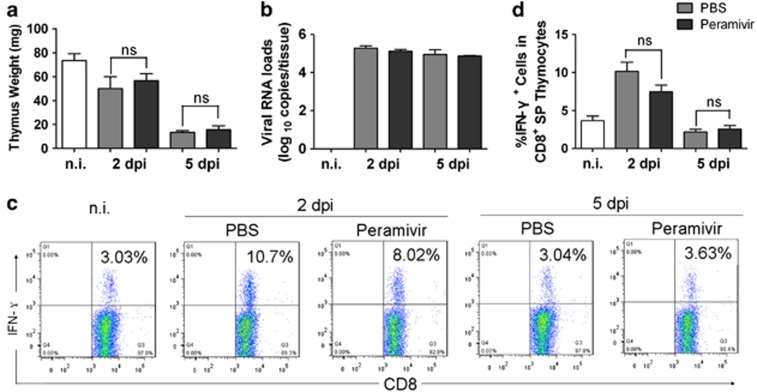
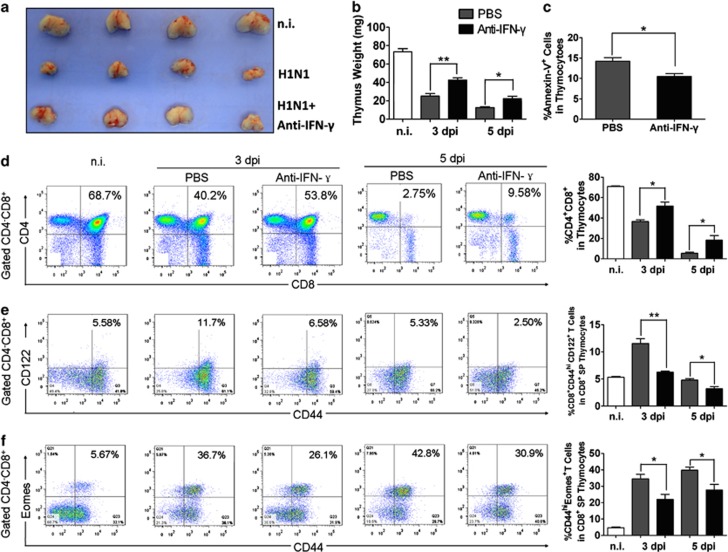
Thymic atrophy has been described as a consequence of infection by several pathogens including highly pathogenic avian influenza virus and is induced through diverse mechanisms. However, whether influenza A(H1N1)pdm09 infection induces thymic atrophy and the mechanisms underlying this process have not been completely elucidated. Our results show that severe infection of influenza A(H1N1)pdm09 led to progressive thymic atrophy and CD4+ CD8+ double-positive (DP) T-cells depletion due to apoptosis. The viruses were present in thymus, where they activated thymic innate CD8(+)CD44(hi) single-positive (SP) thymocytes to secrete a large amount of IFN-γ. Milder thymic atrophy was observed in innate CD8+ T-cell-deficient mice (C57BL/6J). Neutralization of IFN-γ could significantly rescue the atrophy, but peramivir treatment did not significantly alleviate thymic atrophy. In this study, we demonstrated that thymic innate CD8(+)CD44(hi) SP T-cells have critical roles in influenza A(H1N1)pdm09 infection-induced thymic atrophy through secreting IFN-γ. This exceptional mechanism might serve as a target for the prevention and treatment of thymic atrophy induced by influenza A(H1N1)pdm09.


Figures

Figure 1
Figure 1
Thymic atrophy induced by severe influenza A(H1N1)pdm09 infection. (a) Morphology of a control (n.i.) and influenza virus-infected (2 dpi and 5 dpi) thymus in mice. (b) Changes in weight and (c) the number of total thymocytes in non-infected or 1, 2, 3, 5 or 7 dpi thymuses (n=3). (d) H&E staining showing thymus histology in response to H1N1 influenza A virus infection at different dpi (original magnification, × 50). (e) Changes in the ratios of different thymocyte subsets (DN, SP and DP) analyzed by flow cytometry in non-infected or 1, 2, 3, 5 or 7-dpi thymuses (n=3). FACS plots were gated on thymocytes. One representative FACS plot is presented, and the percentages indicate the proportions of DN, CD8+SP, CD4+SP and DP cells. (f) Changes in the number of DN, SP and DP thymocytes from non-infected or 1, 2, 3, 5 or 7 dpi thymuses (n=3). The data are presented as the mean±S.D. (n=3). The histogram represents the mean of three independent experiments. Significant differences from the non-infected control were revealed by an unpaired, two-tailed t-test. *P<0.05, **P<0.01 and ***P<0.001
Figure 2
Figure 2
Detection of the DP subset in peripheral organs and apoptosis of thymocytes in the thymus. (a) DP subsets in the mediastinal lymph nodes (MLN), spleen, peripheral blood and lungs of control or 2-dpi and 5-dpi mice were analyzed by flow cytometry; the FACS plots were gated on CD3+ lymphocytes. Percentages indicate the proportions of CD4+CD8+ DP cells. (b) In situ detection of thymocyte apoptosis using the In Situ Cell Death Detection Kit (TUNEL assay). The brown stain represents DNA fragmentation of apoptotic cells, and the blue stain shows the nuclei stained with hematoxylin. There were more apoptotic cells in the COR at 2 and 3 dpi compared with the non-infected thymus. Arrows indicate positive staining. (c) Apoptotic cells per 104μm2 were counted in the cortex. (d) The apoptotic thymocytes were identified by annexin-V and PI staining. The FACS plots were gated on thymocytes. One representative FACS plot is presented, and the percentages indicate the proportions of apoptotic cells. (e) The annexin-V-positive thymocytes were identified by CD4 and CD8 staining. The percentages indicate the proportions of CD4+CD8+ DP cells. The data are presented as the mean±S.D. (n=3). Significant differences from the non-infected control were determined by an unpaired two-tailed t-test. *P<0.05, ***P<0.001. COR, cortex; MED, medulla
Figure 3
Figure 3
Presence of influenza A(H1N1)pdm09 virus in the thymus. (a) Influenza A virus-encoded protein was detected using immunohistochemistry with the anti-influenza A virus antibody. Virus-encoded protein was present in the thymus of 2-dpi mice, but not in non-infected mice. Lung tissue from 2-dpi mice was used as the positive control. The brown stain represents the virus protein-positive cells, and the blue stain shows nuclei stained with hematoxylin. Arrows indicate positive staining (original magnification, × 200). (b) The virus HA gene was detected in the thymus and lungs of non-infected or infected mice at 2, 3 and 5 dpi by qRT-PCR (n=6). The values were shown as mean±S.D. (c) Growth properties of viruses. At 2, 3 and 5 dpi, thymus and lung tissues were collected, and virus titers were determined by plaque assays in MadinDarby canine kidney cells. The values were presented as mean±S.D. from six mice. (d) Confocal immunofluorescence analysis of virus-encoded proteins and DCs. Virus-encoded protein labeled with anti-influenza A virus antibody was shown in green, DCs labeled with the rat anti-mouse dendritic/interdigitating cell antibody were shown in red, and nuclei stained by DAPI were shown in blue (original magnification, × 630). DC, dendritic cell; T, thymocytes; VP, virus-encoded protein
Figure 4
Figure 4
Assessment of cytokine levels in the thymus and concentration of corticosterone in the serum. (a–g) The concentrations of certain associated cytokines in the thymus were determined using the Bio-Plex Mouse Cytokines 23-Plex panel and Th17 8-Plex panel arrays and normalized to homogenized thymus protein content. (h) Elevated IFN-γ mRNA transcription analyzed by quantitative real-time PCR. (i) Concentration of corticosterone in the serum was measured by ELISA. The data are presented as the mean±S.D. (n=3). Significant differences from the non-infected control were revealed by an unpaired two-tailed t-test. *P<0.05, **P<0.01 and ***P<0.001
Figure 5
Figure 5
Increased percentage of innate CD8+CD44hiCD122+Eomes+ SP T cells in the thymus of infected mice. (a) Increased percentage of IFN-γ+ cells in the thymocytes after infection at 2 and 3 dpi. (b) Increased percentage of IFN-γ+ cells in the CD8+ SP T cells, as determined by flow cytometry. The FACS plots were gated on CD8+ SP thymocytes. Percentages indicated the proportions of IFN-γ+ cells. (c) Most of the cells were CD8+CD44hi among the IFN-γ+ thymocytes. Percentages indicated the proportions of CD8+CD44hi cells in IFN-γ+ thymocytes. (d) All the CD8+IFN-γ+ cells highly expressed CD44. Percentages indicated proportions of IFN-γ+CD44hi in CD8+ SP thymocytes. Analysis of CD44 and CD122 (e), and Eomes (f) expression on CD8+ SP T cells from non-infected, 2-dpi or 3-dpi thymuses. One representative FACS plot is presented. Values represent the means±S.D. (n=6) of three independent experiments. Significant differences from the non-infected control were revealed by an unpaired two-tailed t-test. *P<0.05, **P<0.01 and ***P<0.001
Figure 6
Figure 6
Milder thymic atrophy and lower innate CD8+CD44hi T cells in the thymus of C57BL/6J mice. C57BL/6J and BALB/c mice were intranasally infected with influenza A virus strain A/California/07/2009 at 106 TCID50, (a) Percentage of IFN-γ+ cells, (b) innate CD8+CD44hi T cells among CD8+ SP T-cell population in non-infection, 2- and 3-dpi-infected C57BL/6J mice, as determined by flow cytometry. The FACS plots were gated on CD8+ SP thymocytes. Percentages indicate the proportions of IFN-γ+ cells. (c) The numbers of total thymocytes in non-infected or 2-, 3-dpi thymuses were evaluated. The data are presented as the mean±S.D. (n=5). Significant differences compared with the non-infected control are shown. *P<0.05, **P<0.01 and ***P<0.001
Figure 7
Figure 7
Peramivir did not significantly improve the thymic atrophy induced by severe influenza A(H1N1)pdm09 infection. Mice were treated intraperitoneally with PBS or peramivir at a dose of 40 mg/kg daily for 5 days. (a) Changes in thymus weight of non-infected, influenza virus-infected and peramivir-treated mice, or influenza virus-infected and PBS-treated mice. (b) Viral RNA loads of peramivir or PBS-treated mice thymus at 2 and 5 dpi. (c,d) Percentage of IFN-γ+ cells in the CD8+ SP T-cell population from thymus of non-infected, influenza virus-infected and peramivir- or PBS-treated mice on 2 and 5 dpi (n=6). One representative FACS plot is presented. Values represent the mean±S.D. Significant differences from the non-infected control were revealed by an unpaired two-tailed t-test. ns, not significant
Figure 8
Figure 8
Neutralization of IFN-γ-ameliorated influenza A(H1N1)pdm09-induced thymic atrophy. For neutralizing endogenous IFN-γ, mice were either intraperitoneally injected with the rat anti-mouse IFN-γ monoclonal antibody or with PBS as control. (a) Morphology of a non-infected, influenza virus-infected and anti-IFN-γ or PBS-treated thymus at 3 dpi. (b) Changes in thymus weight of non-infected, influenza virus-infected (3 dpi and 5 dpi) and anti-IFN-γ or PBS-treated mice (n=5). (c) The apoptotic thymocytes of anti-IFN-γ or PBS-treated mice at 5 dpi (n=5) were analyzed as in Figure 2d. (d) Changes in the ratios of the DP thymocytes subset analyzed by flow cytometry in non-infected, influenza virus-infected and anti-IFN-γ or PBS-treated mice (n=5). FACS plots were gated on thymocytes. (e) Analysis of CD44 and CD122 or (f) CD44 and Eomes expression on CD8+ SP T cells (n=5). One representative FACS plot is presented. Values represent the means±S.D. Significant differences from the non-infected control were revealed by an unpaired two-tailed t-test. *P<0.05, **P<0.01 and ***P<0.001

Similar articles

Cited by

References

    1. 1Centers for Disease Control and Prevention (CDC). Swine influenza A (H1N1) infection in two children–Southern California March-April 2009. MMWR Morb Mortal Wkly Rep 2009; 58: 400–402. - PubMed
    1. 2Chowell G, Bertozzi SM, Colchero MA, Lopez-Gatell H, Alpuche-Aranda C, Hernandez M et al. Severe respiratory disease concurrent with the circulation of H1N1 influenza. N Engl J Med 2009; 361: 674–679. - PubMed
    1. 3Kumar A, Zarychanski R, Pinto R, Cook DJ, Marshall J, Lacroix J et al. Critically ill patients with 2009 influenza A(H1N1) infection in Canada. JAMA 2009; 302: 1872–1879. - PubMed
    1. 4Perez-Padilla R, de la Rosa-Zamboni D, Ponce de Leon S, Hernandez M, Quinones-Falconi F, Bautista E et al. Pneumonia and respiratory failure from swine-origin influenza A (H1N1) in Mexico. N Engl J Med 2009; 361: 680–689. - PubMed
    1. 5Centers for Disease Control and Prevention (CDC). Update: novel influenza A (H1N1) virus infection - Mexico, March-May, 2009. MMWR Morb Mortal Wkly Rep 2009; 58: 585–589. - PMC - PubMed

Publication types

MeSH terms