

Sequence analysis of six blood pressure candidate regions in 4,178 individuals: the Cohorts for Heart and Aging Research in Genomic Epidemiology (CHARGE) targeted sequencing study
- PMID: 25275628
- PMCID: PMC4183565
- DOI: 10.1371/journal.pone.0109155
Sequence analysis of six blood pressure candidate regions in 4,178 individuals: the Cohorts for Heart and Aging Research in Genomic Epidemiology (CHARGE) targeted sequencing study
Abstract
Background: Genome-wide association studies (GWAS) identified multiple loci for blood pressure (BP) and hypertension. Six genes--ATP2B1, CACNB2, CYP17A1, JAG1, PLEKHA7, and SH2B3--were evaluated for sequence variation with large effects on systolic blood pressure (SBP), diastolic blood pressure (DBP), pulse pressure (PP), and mean arterial pressure (MAP).
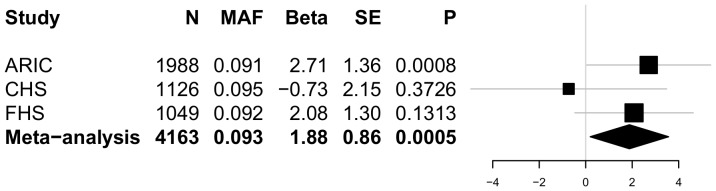
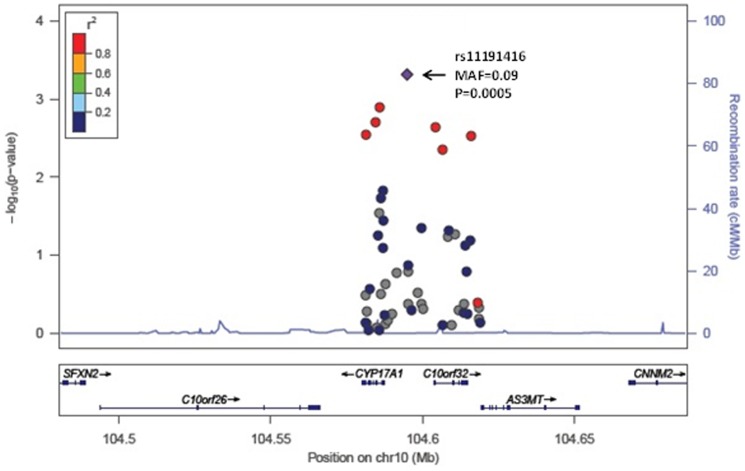
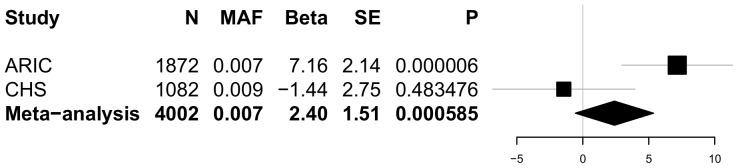
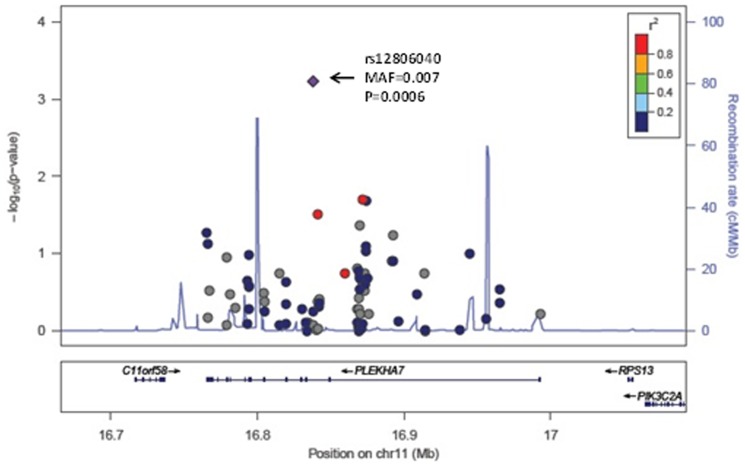
Methods and results: Targeted genomic sequence was determined in 4,178 European ancestry participants from the Cohorts for Heart and Aging Research in Genomic Epidemiology (CHARGE) Consortium. Common variants (≥50 minor allele copies) were evaluated individually and rare variants (minor allele frequency, MAF≤1%) were aggregated by locus. 464 common variants were identified across the 6 genes. An upstream CYP17A1 variant, rs11191416 (MAF = 0.09), was the most significant association for SBP (P = 0.0005); however the association was attenuated (P = 0.0469) after conditioning on the GWAS index single nucleotide polymorphism (SNP). A PLEKHA7 intronic variant was the strongest DBP association (rs12806040, MAF = 0.007, P = 0.0006) and was not in LD (r² = 0.01) with the GWAS SNP. A CACNB2 intronic SNP, rs1571787, was the most significant association with PP (MAF = 0.27, P = 0.0003), but was not independent from the GWAS SNP (r² = 0.34). Three variants (rs6163 and rs743572 in the CYP17A1 region and rs112467382 in PLEKHA7) were associated with BP traits (P<0.001). Rare variation, aggregately assessed in the 6 regions, was not significantly associated with BP measures.
Conclusion: Six targeted gene regions, previously identified by GWAS, did not harbor novel variation with large effects on BP in this sample.
Conflict of interest statement
Figures
References
Publication types
MeSH terms
Grants and funding
- 5RC2HL102419/HL/NHLBI NIH HHS/United States
- N01-HC-85081/HC/NHLBI NIH HHS/United States
- R01 HL087652/HL/NHLBI NIH HHS/United States
- N01-HC-85086/HC/NHLBI NIH HHS/United States
- N01-HC-85082/HC/NHLBI NIH HHS/United States
- R01 HL080295/HL/NHLBI NIH HHS/United States
- HL080295/HL/NHLBI NIH HHS/United States
- HHSN268201100012C/HL/NHLBI NIH HHS/United States
- N02-HL-6-4278/HL/NHLBI NIH HHS/United States
- N01-HC-25195/HC/NHLBI NIH HHS/United States
- RC2 HL102419/HL/NHLBI NIH HHS/United States
- HHSN268201100009I/HL/NHLBI NIH HHS/United States
- N01 HC085080/HL/NHLBI NIH HHS/United States
- N01-HC-85085/HC/NHLBI NIH HHS/United States
- HHSN268201100010C/HL/NHLBI NIH HHS/United States
- R01 AG015928/AG/NIA NIH HHS/United States
- HHSN268201100008C/HL/NHLBI NIH HHS/United States
- U01 HL080295/HL/NHLBI NIH HHS/United States
- HHSN268201100008I/HL/NHLBI NIH HHS/United States
- HHSN268201100005G/HL/NHLBI NIH HHS/United States
- N01 HC085082/HL/NHLBI NIH HHS/United States
- HHSN268201100007C/HL/NHLBI NIH HHS/United States
- HL105756/HL/NHLBI NIH HHS/United States
- N01 HC015103/HC/NHLBI NIH HHS/United States
- N01 HC085086/HL/NHLBI NIH HHS/United States
- N01 HC085083/HL/NHLBI NIH HHS/United States
- AG-15928/AG/NIA NIH HHS/United States
- R56 AG020098/AG/NIA NIH HHS/United States
- HHSN268201100011I/HL/NHLBI NIH HHS/United States
- HHSN268201100011C/HL/NHLBI NIH HHS/United States
- N01 HC085085/HC/NHLBI NIH HHS/United States
- AG-20098/AG/NIA NIH HHS/United States
- HL087652/HL/NHLBI NIH HHS/United States
- U54 HG003273/HG/NHGRI NIH HHS/United States
- R01 HL105756/HL/NHLBI NIH HHS/United States
- AG-027058/AG/NIA NIH HHS/United States
- HHSN268201100006C/HL/NHLBI NIH HHS/United States
- N01-HC-35129/HC/NHLBI NIH HHS/United States
- N01 HC-55222/HC/NHLBI NIH HHS/United States
- HHSN268201200036C/HL/NHLBI NIH HHS/United States
- N01 HC025195/HL/NHLBI NIH HHS/United States
- N01 HC055222/HL/NHLBI NIH HHS/United States
- HHSN268201100005I/HL/NHLBI NIH HHS/United States
- N01 HC085079/HL/NHLBI NIH HHS/United States
- N01-HC-85083/HC/NHLBI NIH HHS/United States
- N01-HC-75150/HC/NHLBI NIH HHS/United States
- N01-HC-85080/HC/NHLBI NIH HHS/United States
- N01 HC-15103/HC/NHLBI NIH HHS/United States
- N01 HC085084/HC/NHLBI NIH HHS/United States
- R01 AG020098/AG/NIA NIH HHS/United States
- HHSN268201100009C/HL/NHLBI NIH HHS/United States
- HHSN268201100005C/HL/NHLBI NIH HHS/United States
- N01-HC-45133/HC/NHLBI NIH HHS/United States
- HHSN268201100007I/HL/NHLBI NIH HHS/United States
- N01-HC-85079/HC/NHLBI NIH HHS/United States
- N01-HC-85239/HC/NHLBI NIH HHS/United States
- AG-023629/AG/NIA NIH HHS/United States
- N01 HC075150/HL/NHLBI NIH HHS/United States
- R01 AG023629/AG/NIA NIH HHS/United States
- R01 AG027058/AG/NIA NIH HHS/United States
- N01 HC045133/HC/NHLBI NIH HHS/United States
- N01 HC035129/HC/NHLBI NIH HHS/United States
- R56 AG023629/AG/NIA NIH HHS/United States
- N01 HC085081/HL/NHLBI NIH HHS/United States
- N01-HC-85084/HC/NHLBI NIH HHS/United States
LinkOut - more resources
Full Text Sources
Other Literature Sources
Medical
Research Materials
Miscellaneous
