. 2014 Dec 7;14(23):4540-51.
doi: 10.1039/c4lc00642a. Epub 2014 Oct 2.

Parallel microfluidic chemosensitivity testing on individual slice cultures

Affiliations

Parallel microfluidic chemosensitivity testing on individual slice cultures

Tim C Chang et al. Lab Chip. .

Abstract

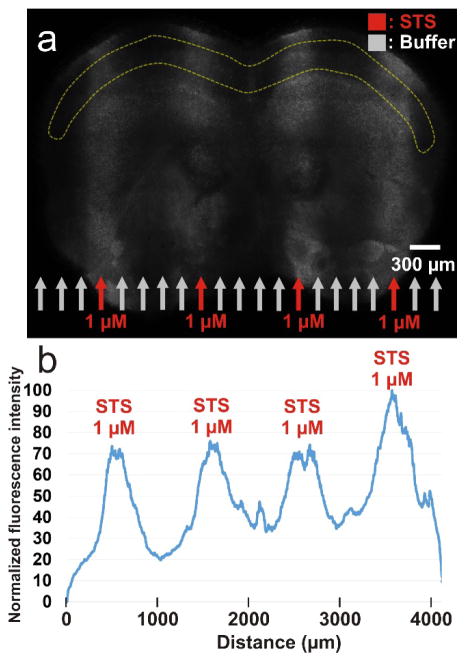
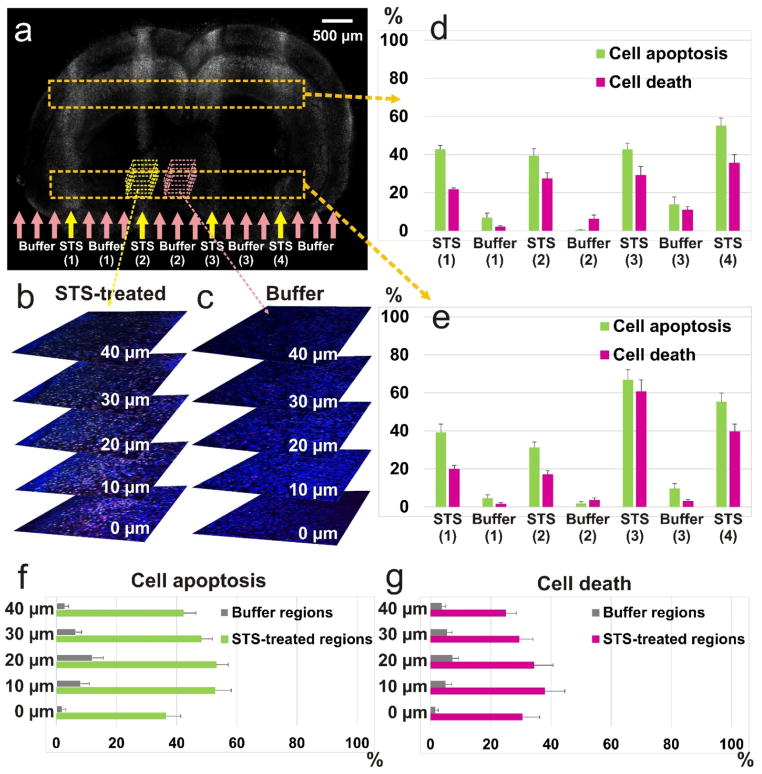
There is a critical unmet need to tailor chemotherapies to individual patients. Personalized approaches could lower treatment toxicity, improve the patient's quality of life, and ultimately reduce mortality. However, existing models of drug activity (based on tumor cells in culture or animal models) cannot accurately predict how drugs act in patients in time to inform the best possible treatment. Here we demonstrate a microfluidic device that integrates live slice cultures with an intuitive multiwell platform that allows for exposing the slices to multiple compounds at once or in sequence. We demonstrate the response of live mouse brain slices to a range of drug doses in parallel. Drug response is measured by imaging of markers for cell apoptosis and for cell death. The platform has the potential to allow for identifying the subset of therapies of greatest potential value to individual patients, on a timescale rapid enough to guide therapeutic decision-making.


Figures

Figure 1
Figure 1
Microfluidic device design (a) Layer-by-layer schematic view of the device. The device includes (from top to bottom) a modified bottomless 96-well plate featuring 80 inlet wells after the central 16 wells have been removed; a PDMS layer containing through holes layer; a PDMS microchannel network layer; and the microfluidic chip (where the porous membrane with the tissue is placed). (b) Cross-sectional schematic of the device. The device is operated by gravity flow and the total flow rate is driven by a syringe pump through a common outlet: one syringe pump is able to control flow across all 80 fluidic streams. Tissue slices are cultured on a PTFE porous membrane. The wet membrane seals the open microchannels by capillarity, which allows for fluidic stream transport of culture medium to tissue. (c) Micrograph of the microfluidic platform loaded with three dyes (yellow, blue and red) in sequence to generate an alternating pattern of yellow, blue and red microchannels across the perfusion membrane. (d) Micrograph of the tissue culture area after loading the platform shown in (c) with a porous membrane that has two mouse brain slices attached.
Figure 2
Figure 2
Selective chemical delivery to tissue slices. (a) Transfer from the underlying fluid streams into the PTFE porous membrane: the extent of lateral diffusion within the membrane (direction orthogonal to flow) scales with the flow velocity underneath the membrane, as one would expect from a free-flowing laminar flow. (b) Steady-state concentration profile modeled with Comsol using an ideal 200 μm-thick tissue slice under conditions of diffusion-based transport. The drug (C1) and buffer (C0) channels act as infinite sources and sinks, respectively. (c) Micrograph of a fixed mouse brain slice exposed to two different cell nuclear binding agents (Hoechst, blue, and Sytox Green, green) through the alternating streams in our microfluidic device for 5 hrs. The image is the result of stitching 42 fluorescence microscopy images. (d) Demonstration of sequential drug exposure. The porous membrane is rotated and repositioned (with tissue attached to the membrane) in the device between the first and the second reagent deliveries. As a result, n reagents delivered in parallel result in the formation of n2 junctions where n2 sequential pairs of reagents (“sequences”) are delivered. For this sample, the image only contains half of a mouse brain slice because the width of a coronal-cut adult mouse brain slice is longer than the fluidic channels.
Figure 3
Figure 3. Drug response in intact mouse brain slices
STS was used as a model cytotoxic agent. (a) Equivalent doses (1 μM for 18 hrs) of STS were delivered to coronal-cut mouse brain slices with the same interval distance (four buffer channels) in between each of two STS solutions. Fluorescent lanes indicate apoptotic cell staining by CellEvent in STS-exposed regions. (b) 2D fluorescence intensity profile across dorsal cortex of the mouse brain slice (yellow dashed region in panel a). The plot shows peaks of fluorescence intensity across STS-exposure areas.
Figure 4
Figure 4. Dose-dependent cytotoxicity in intact mouse brain slices
STS was used as a model cytotoxic agent. (a) Different doses of STS solution were delivered to a coronal-cut mouse brain slice with the same interval distance (two buffer channels) in between each of two STS solutions. Fluorescent lanes of apoptotic cells stained by CellEvent, formed at the STS-exposed regions in which the density of apoptotic cells is positively correlated with the STS dose. (b) 2D fluorescence intensity profile across dorsal cortex of the mouse brain slice (yellow dashed region in panel (a). The plot shows that the peaks of the fluorescence intensity located at the STS exposure areas correspond with the doses of STS in a dose-dependent manner. The fluorescence intensity plot can be directly used as a drug screening readout on intact tissues. (c) Concentration plot of the dose-dependent experiment. The orange dash curve is a repeat.
Figure 5
Figure 5. Dose-dependent cell killing in intact tissue slice cultures quantified by confocal microscopy
(a)Epifluorescence image (dead-cell staining) of a P1 mouse brain slice after it is selectively treated with STS at four separate regions through four delivery channels (yellow arrows) for 24 hours, followed by apoptotic and dead cell staining. Four lanes of fluorescently labelled dead cells in the brain slice are visible in the STS-exposed areas. (b, c) Optical slices of STS-treated (b) and buffer (c) regions. Five optical slices are acquired at both regions of the tissue slice. Three fluorescence channels from a confocal microscope are used to detect cell nuclei (blue), cell apoptosis (green), and cell death (magenta). (d, e) Percentages of cell apoptosis and cell death across the slice (orange dashed boxes in Fig. 5a). Each error bar shows the standard error of mean. (f, g) Percentages of cell apoptosis (f) and cell death (g) at individual focal planes. Each error bar shows the standard error of mean.
Figure 6
Figure 6. Selective killing of GFP-labeled human GBM xenograft cells by TMZ in an intact xenograft slice culture
(a, b) Selective TMZ treatment on a GBM xenograft slice. The green areas show the GFP-labelled glioma cells within the slice. Seven parallel fluidic streams containing 1 mM TMZ (white-dashed arrows on panel a) and red arrows on panel b) were delivered to the slice with 3 buffer streams in between each of the two TMZ streams. The disappearance of GFP-labeled glioma cells was found after 48 hr of TMZ delivery at the TMZ-exposed regions (b) compared to the image of the same slice before TMZ exposure (a). (c) A confocal image taken from the yellow-dashed box in (b) after 48 hr TMZ exposure shows the loss of GFP-labeled glioma cells at the TMZ-exposed region in a spatially-defined manner.

References

    1. Provocative Questions. http://provocativequestions.nci.nih.gov/rfa.
    1. C. B. T. R. o. t. U. S. (CBTRUS) CBTRUS Statistical Report: Primary Brain and Central Nervous System Tumors Diagnosed in Eighteen States in 2002–2006. 2009.
    1. Brennan CW, Verhaak RG, McKenna A, Campos B, Noushmehr H, Salama SR, Zheng S, Chakravarty D, Sanborn JZ, Berman SH. Cell. 2013;155:462–477. - PMC - PubMed
    1. Hegi ME, Liu L, Herman JG, Stupp R, Wick W, Weller M, Mehta MP, Gilbert MR. Journal of Clinical Oncology. 2008;26:4189–4199. - PubMed
    1. Sun Y, Campisi J, Higano C, Beer TM, Porter P, Coleman I, True L, Nelson PS. Nature medicine. 2012;18:1359–1368. - PMC - PubMed

MeSH terms

Substances