

A Big Data Guide to Understanding Climate Change: The Case for Theory-Guided Data Science
- PMID: 25276499
- PMCID: PMC4174912
- DOI: 10.1089/big.2014.0026
A Big Data Guide to Understanding Climate Change: The Case for Theory-Guided Data Science
Abstract
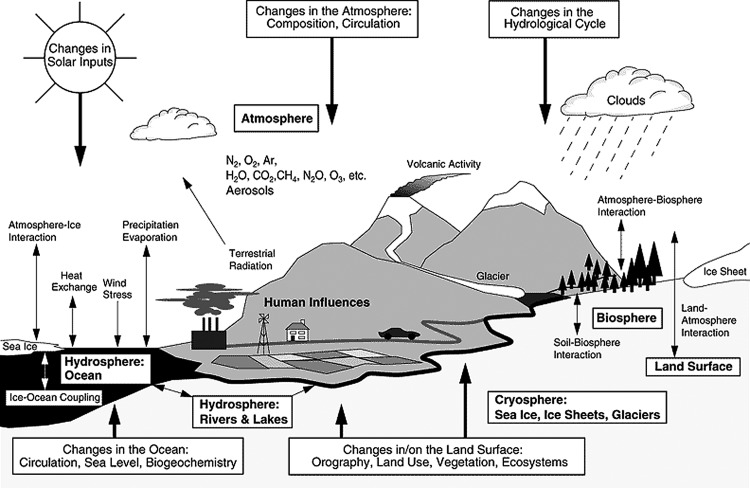
Global climate change and its impact on human life has become one of our era's greatest challenges. Despite the urgency, data science has had little impact on furthering our understanding of our planet in spite of the abundance of climate data. This is a stark contrast from other fields such as advertising or electronic commerce where big data has been a great success story. This discrepancy stems from the complex nature of climate data as well as the scientific questions climate science brings forth. This article introduces a data science audience to the challenges and opportunities to mine large climate datasets, with an emphasis on the nuanced difference between mining climate data and traditional big data approaches. We focus on data, methods, and application challenges that must be addressed in order for big data to fulfill their promise with regard to climate science applications. More importantly, we highlight research showing that solely relying on traditional big data techniques results in dubious findings, and we instead propose a theory-guided data science paradigm that uses scientific theory to constrain both the big data techniques as well as the results-interpretation process to extract accurate insight from large climate data.
Figures
References
-
- Overpeck JT, Meehl GA, Bony S, Easterling DR. Climate data challenges in the 21st century. Science 2011; 331:700. - PubMed
-
- Langley P. The changing science of machine learning. Mach Learn 2011; 82:275–279
-
- Steinbach M, et al. . Clustering earth science data: Goals, issues and results. In: Proceedings of the Fourth KDD Workshop on Mining Scientific Datasets, 2001
-
- Tan P, et al. . Finding spatio-temporal patterns in earth science data. In: KDD 2001 Workshop on Temporal Data Mining, 2001
-
- Steinbach M., et al. . Clustering earth science data: Goals, issues, and results. In: Getoor L, Senator TE, Domingos P, Faloutsos C. (Eds.): Proceedings of the Ninth ACM SIGKDD International Conference on Knowledge Discovery and Data Mining, Washington, DC, USA, August24–27, 2003 ACM 2003. ISBN 1-58113-737-0 pp. 446–455
LinkOut - more resources
Full Text Sources
Other Literature Sources