. 2014 Sep 15;5(17):7540-8.
doi: 10.18632/oncotarget.2272.

Array-based genome-wide RNAi screening to identify shRNAs that enhance p53-related apoptosis in human cancer cells

Affiliations

Array-based genome-wide RNAi screening to identify shRNAs that enhance p53-related apoptosis in human cancer cells

Masashi Idogawa et al. Oncotarget. .

Abstract

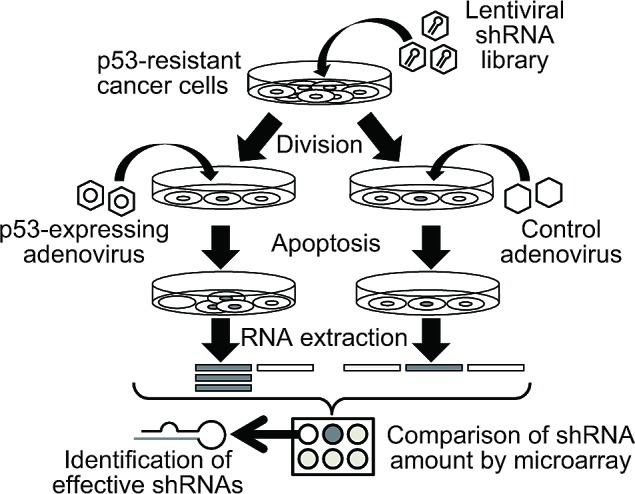
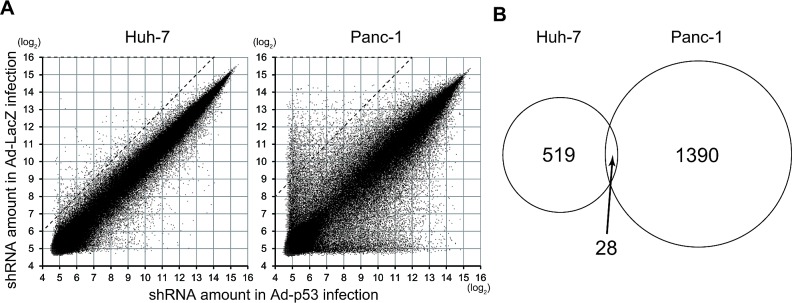
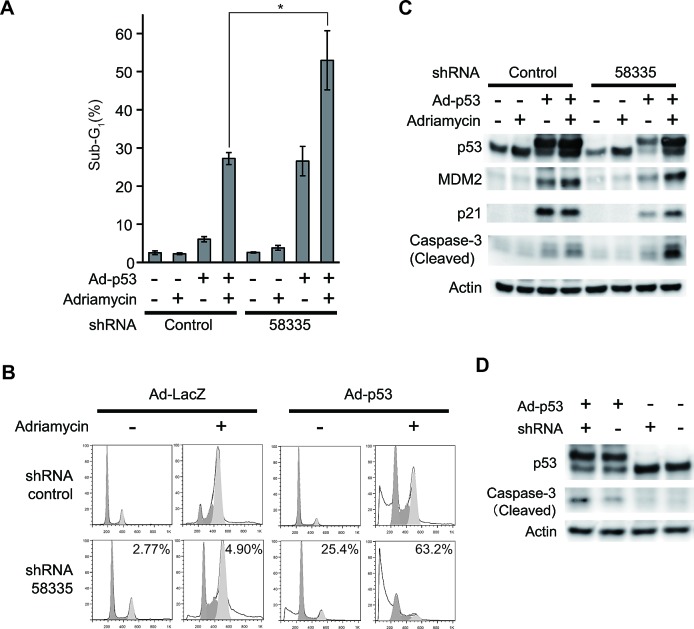
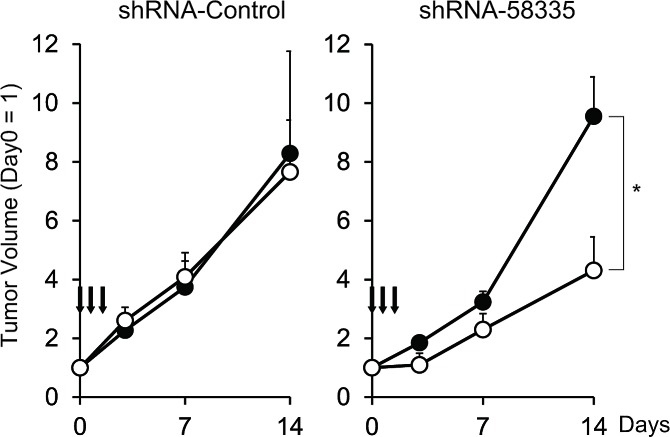
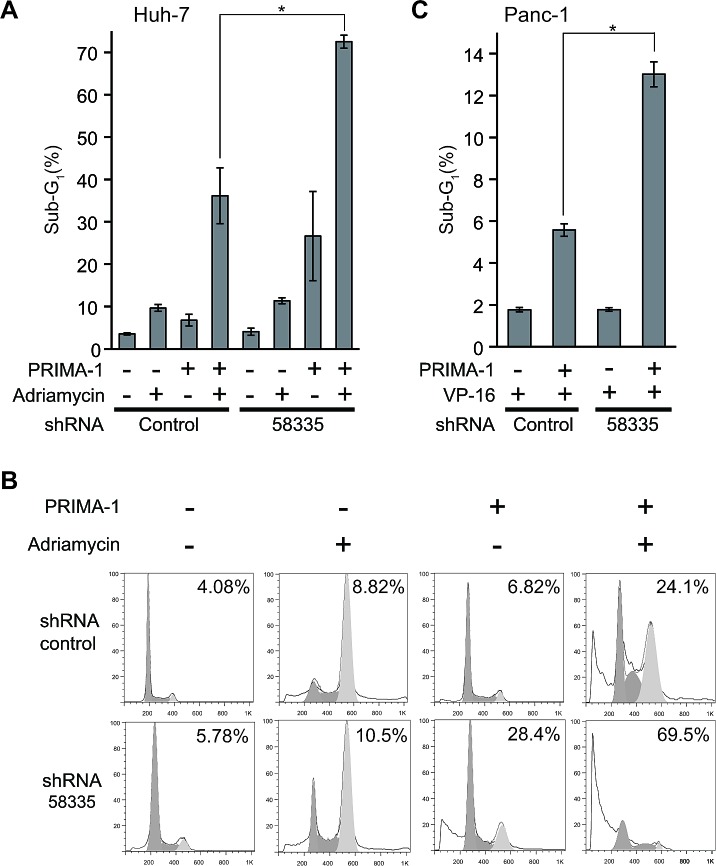
p53 transduction is a potentially effective cancer therapy but does not result in a good therapeutic response in all human cancers due to resistance to apoptosis. To discover factors that overcome resistance to p53-induced apoptosis, we attempted to identify RNAi sequences that enhance p53-induced apoptosis. We screened a genome-wide lentiviral shRNA library in liver cancer Huh-7 and pancreatic cancer Panc-1 cells, both of which resist p53-induced apoptosis. After the infection of adenovirus expressing p53 or LacZ as a control, shRNA-treated populations were analyzed by microarray. We identified shRNAs that were significantly decreased in p53-infected cells compared with control cells. Among these shRNAs, shRNA-58335 was markedly decreased in both cancer cell lines tested. shRNA-58335 enhanced p53-related apoptosis in vitro and augmented the inhibitory effect of adenoviral p53 transduction on tumor growth in vivo. Furthermore, the enhanced apoptotic response by shRNA-58335 was also confirmed by treatment with PRIMA-1, which reactivates mutant p53, instead of adenoviral p53 transduction. We found that shRNA-58335 evokes the apoptotic response following p53 transduction or functional restoration of p53 with a small molecule drug in cancer cells resistant to p53-induced apoptosis. The combination of p53 restoration and RNAi-based drugs is expected to be a promising novel cancer therapy.


Conflict of interest statement

Conflict of interest

The authors have no conflicts of interest to declare.

Figures

Figure 1
Figure 1. Schematic representation of the array-based shRNA library screening process
p53-resistant cancer cells were infected with a pooled lentiviral shRNA library. After lentiviral infection, the cells were infected with adenovirus expressing p53 or LacZ. The shRNA population was analyzed by a cDNA microarray-based approach.
Figure 2
Figure 2. Analysis of the shRNA library screen in p53-transduced cells
(A) shRNA populations were quantified by cDNA microarray in p53-transduced Huh-7 and Panc-1 cells. The amount of each shRNA in p53-transduced cells was plotted against the amount of the shRNA in LacZ-transduced control cells as log2. In Huh-7 cells, 547 shRNAs decreased more than 4-fold in p53-transduced cells compared with control cells. In Panc-1 cells, 1418 shRNAs decreased more than 16-fold in p53-transduced cells compared with control cells (areas encircled by dashed lines). (B) The overlap of the selected shRNAs in Huh-7 and Panc-1 cells is displayed in a Venn diagram.
Figure 3
Figure 3. Effect of shRNA-58335 on p53-induced apoptosis
(A) Huh-7 cells were stably infected with lentivirus expressing shRNA-58335 or a control sequence. These cells were then infected with an adenovirus expressing p53 (Ad-p53: +) or LacZ (Ad-p53: -) as a control at an MOI of 200. Twenty-four hours after infection, the cells were treated with adriamycin (0.5 μg/ml) or not. Forty-eight hours after treatment, the cells were analyzed by flow cytometry. The percentage of cells in the sub-G1 phase is indicated. Error bars indicate the S.E. * indicates a p value < 0.05 by a t-test. (B) Representative flow cytometry data in Huh-7 cells infected with Ad-p53. The percentage of cells in the sub-G1 phase is indicated. (C) Under the same conditions used in (A), total cell lysates were extracted and analyzed by Western blot with the indicated antibodies. (D) SW480 cells were infected with lentivirus expressing shRNA-58335 (shRNA: +) or a control sequence (shRNA: -). These cells were then infected with an adenovirus expressing p53 (Ad-p53: +) or LacZ (Ad-p53: -) as a control at an MOI of 200. Forty-eight hours after infection, total cell lysates were extracted and analyzed by Western blot with the indicated antibodies.
Figure 4
Figure 4. Therapeutic effect of shRNA-58335 in vivo
Huh-7 cells stably infected with lentivirus expressing shRNA-58335 or control sequences were injected s.c. into nude mice. When the tumor volume reached 100 mm3, adenovirus expressing p53 (Ad-p53) or LacZ as a control (Ad-LacZ) was injected directly into the tumors at days 0, 1 and 2 (indicated by arrows). Ad-p53, open circle; Ad-LacZ, closed circle. The data represent the average volume of three independent tumors injected with adenovirus. The volume of each tumor is expressed relative to the volume at day 0, which was set as 1. Error bars indicates S.E. * indicates a p value < 0.05 by a t-test.
Figure 5
Figure 5. Effect of shRNA-58335 on apoptosis with the functional restoration of p53 with PRIMA-1
(A) Huh-7 cells stably infected with lentivirus expressing shRNA-58335 or control sequences were treated with PRIMA-1 (200 μM) and/or adriamycin (0.5 μg/ml). Seventy-two hours after treatment, the cells were analyzed by flow cytometry. The percentage of cells in the sub-G1 phase is indicated. (B) Representative flow cytometry data in Huh-7 cells treated with PRIMA-1 and adriamycin. The percentage of cells in the sub-G1 phase is indicated. (C) Panc-1 cells were stably infected with lentivirus expressing shRNA-58335 or a control sequence. These cells were treated with VP-16 (300 μM) in the presence or absence of PRIMA-1 (200 μM). Forty-eight hours after treatment, the cells were analyzed by flow cytometry. The percentage of cells in the sub-G1 phase is indicated. In (A) and (C), error bars indicate the S.E. * indicates a p value < 0.05 by t-test.

References

    1. Vogelstein B, Lane D, Levine AJ. Surfing the p53 network. Nature. 2000;408(6810):307–310. - PubMed
    1. Brosh R, Rotter V. When mutants gain new powers: news from the mutant p53 field. Nat Rev Cancer. 2009;9(10):701–713. - PubMed
    1. Roth JA, Nguyen D, Lawrence DD, Kemp BL, Carrasco CH, Ferson DZ, Hong WK, Komaki R, Lee JJ, Nesbitt JC, Pisters KM, Putnam JB, Schea R, Shin DM, Walsh GL, Dolormente MM, et al. Retrovirus-mediated wild-type p53 gene transfer to tumors of patients with lung cancer. Nat Med. 1996;2(9):985–991. - PubMed
    1. Tazawa H, Kagawa S, Fujiwara T. Advances in adenovirus-mediated p53 cancer gene therapy. Expert Opin Biol Ther. 2013;13(11):1569–1583. - PubMed
    1. Blagosklonny MV. Paradox of Bcl-2 (and p53): why may apoptosis-regulating proteins be irrelevant to cell death? Bioessays. 2001;23(10):947–953. - PubMed

Publication types

Substances