. 2014 Oct 3;15(1):847.
doi: 10.1186/1471-2164-15-847.

SNP array profiling of mouse cell lines identifies their strains of origin and reveals cross-contamination and widespread aneuploidy

Affiliations

SNP array profiling of mouse cell lines identifies their strains of origin and reveals cross-contamination and widespread aneuploidy

John P Didion et al. BMC Genomics. .

Abstract

Background: The crisis of Misidentified and contaminated cell lines have plagued the biological research community for decades. Some repositories and journals have heeded calls for mandatory authentication of human cell lines, yet misidentification of mouse cell lines has received little publicity despite their importance in sponsored research. Short tandem repeat (STR) profiling is the standard authentication method, but it may fail to distinguish cell lines derived from the same inbred strain of mice. Additionally, STR profiling does not reveal karyotypic changes that occur in some high-passage lines and may have functional consequences. Single nucleotide polymorphism (SNP) profiling has been suggested as a more accurate and versatile alternative to STR profiling; however, a high-throughput method for SNP-based authentication of mouse cell lines has not been described.

Results: We have developed computational methods (Cell Line Authentication by SNP Profiling, CLASP) for cell line authentication and copy number analysis based on a cost-efficient SNP array, and we provide a reference database of commonly used mouse strains and cell lines. We show that CLASP readily discriminates among cell lines of diverse taxonomic origins, including multiple cell lines derived from a single inbred strain, intercross or wild caught mouse. CLASP is also capable of detecting contaminants present at concentrations as low as 5%. Of the 99 cell lines we tested, 15 exhibited substantial divergence from the reported genetic background. In all cases, we were able to distinguish whether the authentication failure was due to misidentification (one cell line, Ba/F3), the presence of multiple strain backgrounds (five cell lines), contamination by other cells and/or the presence of aneuploid chromosomes (nine cell lines).

Conclusions: Misidentification and contamination of mouse cell lines is potentially as widespread as it is in human cell culture. This may have substantial implications for studies that are dependent on the expected background of their cell cultures. Laboratories can mitigate these risks by regular authentication of their cell cultures. Our results demonstrate that SNP array profiling is an effective method to combat cell line misidentification.


Figures

Figure 1
Figure 1
Genotypes uniquely identify mouse strains and cell lines. A) Density plots of alignment scores for all pairwise comparisons between reference samples (purple) and between cell lines (green), and maximum alignment scores for each cell line compared to all reference samples (orange). Alignment scores range from 0.0 (no genotypes in common) to 1.0 (genetically identical). High identity in some pairwise cell line comparisons is due to inclusion of replicates. B) Heat map of all comparisons between cell lines (columns) and reference samples (rows). Columns are ordered based on clustering of cell lines by genotype, as shown in the dendrogram at the top of the plot (branch lengths are arbitrary).
Figure 2
Figure 2
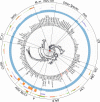
Mouse cell lines have contamination and widespread aneuploidy. Neighbor-joining tree of 117 cell line samples based on genotypes from 3,552 SNP markers. Node colors show the support for each clade, based on 100 resamplings (light blue = lower support, dark blue = higher support). Samples labeled in red are from the Ba/F3 cell line, which was reported to be of BALB origin but is actually derived from C3H. Asterisks denote (*) cell lines known to be derived from cancer tissue, and (**) cell lines of unknown origin. The four circular tracks (from inside to outside) show alignment score (blue), presence of a secondary genetic background (orange), cross-contamination level (purple) and number of chromosomes with evidence of copy number change (red = loss, green = gain). Labels identify groups of cell lines derived from classical inbred strains (129, A, BALB, C3H, C57BL, DBA), intercross (C57BL Hybr = hybrid between C57BL and another background, CCF1 = intercross between two Collaborative Cross (CC) founder strains), Swiss mice (including commercial outbred stocks), wild-derived strains of M. m. musculus or M. m. castaneus origin (M. m. mus, cas), wild mice on non-M. musculus origin (other species), and other backgrounds (Ma/MyJ and PL/J are classical inbred strains, IL6211 is a CC line, and JR4 is derived from a 129xCAST hybrid).
Figure 3
Figure 3
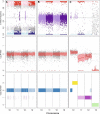
CLASP identifies contamination and copy number aberration in cell lines. Visualizations of genome-wide intensity distributions for A) a sample with cross-contamination (W4/129S6); B) a normal sample from primary tissue (CAST/EiJ x A/J); and C) an aneuploid sample (OB1xB3). Top tracks: B allele frequencies. Each data point represents a marker and is colored by genotype call, AA (blue), AB (purple) or BB (red). Middle tracks: Log R ratios. The red line is the smoothed mean LRR, and the upper and lower bands represent one standard deviation greater and lower than the mean, respectively. Markers colored red have values lying outside the range [-2,2]. Lower tracks: copy number intervals identified by genoCNA. Colors represent the different HMM states (see Sun et al. [24]).
Figure 4
Figure 4
Aneuploidy is pervasive in cell culture. Frequency with which each chromosome was classified by genoCNA as being below our threshold for chromosome loss (mean copy number 1.5, dark gray) or above our threshold for chromosome gain (2.1, light gray).

References

    1. Nature Identity crisis. Nature. 2009;457:935–936. - PubMed
    1. American Type Culture Collection Standards Development Organization Workgroup ASN-0002 Cell line misidentification: the beginning of the end. Nat Rev Cancer. 2010;10:441–448. doi: 10.1038/nrc2852. - DOI - PubMed
    1. Podolak E: Ending Cell Line Contamination by Cutting off Researchers, Biotechniques Online News (2010).
    1. Capes-Davis A, Theodosopoulos G, Atkin I, Drexler HG, Kohara A, MacLeod RAF, Masters JR, Nakamura Y, Reid YA, Reddel RR, Freshney RI. Check your cultures! A list of cross-contaminated or misidentified cell lines. Int J Cancer. 2010;127:1–8. doi: 10.1002/ijc.25242. - DOI - PubMed
    1. Yoshino K, Saijo K, Noro C, Nakamura Y. Development of a simple method to determine the mouse strain from which cultured cell lines originated. Interdisciplinary Bio Central. 2010;2:1–9. doi: 10.4051/ibc.2010.2.4.0014. - DOI

Publication types