

Mesenchymal stromal cells reset the scatter factor system and cytokine network in experimental kidney transplantation
- PMID: 25277788
- PMCID: PMC4193986
- DOI: 10.1186/s12865-014-0044-1
Mesenchymal stromal cells reset the scatter factor system and cytokine network in experimental kidney transplantation
Abstract
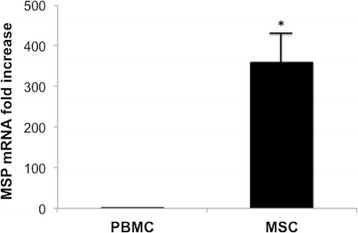
Background: In former studies we showed in a rat model of renal transplantation that Mesenchymal Stromal Cells (MSC) prevent acute rejection in an independent way of their endowing in the graft. In this study we investigated whether MSC operate by resetting cytokine network and Scatter Factor systems, i.e. Hepatocyte Growth Factor (HGF), Macrophage Stimulating Protein (MSP) and their receptors Met and RON, respectively.
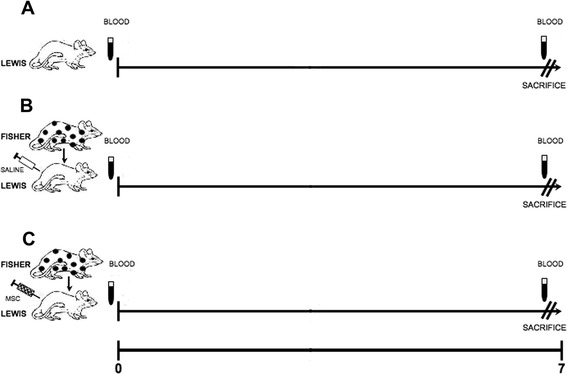
Methods: MSC were injected into the renal artery soon after reperfusion. Controls were grafted untreated and normal rats. Rats were sacrificed 7 days after grafting. Serum and renal tissue levels of IFN-γ, IL-1, IL-2, IL-4, IL-6, IL-10, MSP/RON, HGF/Met systems, Treg lymphocytes were investigated.
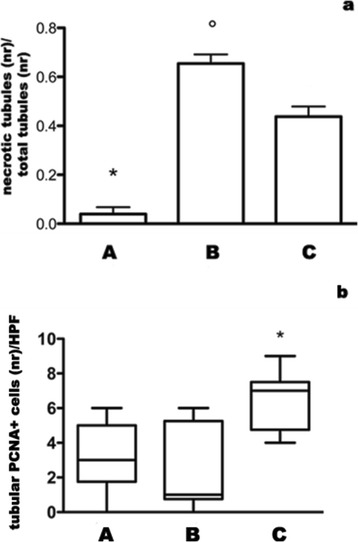
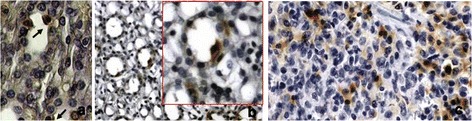
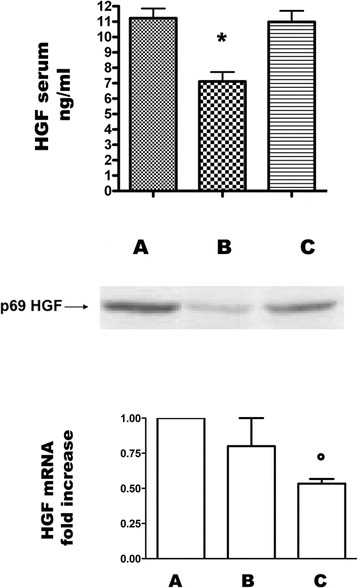
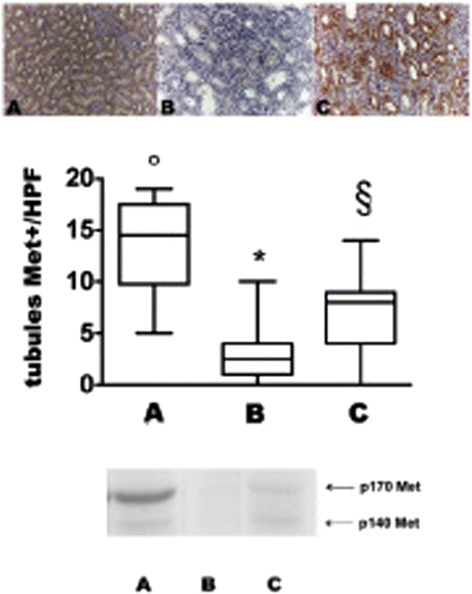
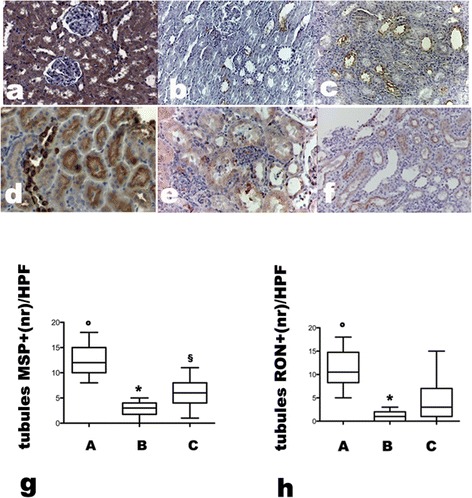
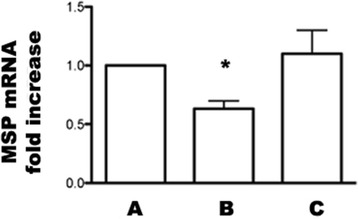
Results: In grafted untreated rats IFN-γ increased in serum and renal tissue and IL-6 rose in serum. MSC prevented both the phenomena, increased IL-10 serum levels and Treg number in the graft. Furthermore MSC increased serum and tissue HGF levels, Met tubular expression and prevented the suppression of tubular MSP/RON expression.
Conclusions: Our results demonstrate that MSC modify cytokine network to a tolerogenic setting, they suppress Th1 cells, inactivate monocytes/macrophage, recruit Tregs. In addition, MSC sustain the expression of the Scatter Factor systems expression, i.e. systems that are committed to defend survival and stimulate regeneration of tubular cells.
Figures
Similar articles
-
Mesenchymal stromal cells improve renal injury in anti-Thy 1 nephritis by modulating inflammatory cytokines and scatter factors.Clin Sci (Lond). 2011 Jan;120(1):25-36. doi: 10.1042/CS20100147. Clin Sci (Lond). 2011. PMID: 20583996
-
Comparative characterization of the HGF/Met and MSP/Ron systems in primary pancreatic adenocarcinoma.Cytokine. 2019 Nov;123:154762. doi: 10.1016/j.cyto.2019.154762. Epub 2019 Jun 26. Cytokine. 2019. PMID: 31254927
-
Hepatocyte growth factor and macrophage-stimulating protein are upregulated during excisional wound repair in rats.Cell Tissue Res. 2001 Nov;306(2):239-50. doi: 10.1007/s004410100443. Cell Tissue Res. 2001. PMID: 11702235
-
The MET receptor tyrosine kinase in invasion and metastasis.J Cell Physiol. 2007 Nov;213(2):316-25. doi: 10.1002/jcp.21183. J Cell Physiol. 2007. PMID: 17607709 Review.
-
The scatter factor signaling pathways as therapeutic associated target in cancer treatment.Curr Med Chem. 2010;17(25):2699-712. doi: 10.2174/092986710791859261. Curr Med Chem. 2010. PMID: 20586722 Review.
Cited by
-
Mesenchymal Stromal Cell Therapy in Solid Organ Transplantation.Front Immunol. 2021 Feb 10;11:618243. doi: 10.3389/fimmu.2020.618243. eCollection 2020. Front Immunol. 2021. PMID: 33643298 Free PMC article. Review.
-
Reparative and Regenerative Effects of Mesenchymal Stromal Cells-Promising Potential for Kidney Transplantation?Int J Mol Sci. 2019 Sep 18;20(18):4614. doi: 10.3390/ijms20184614. Int J Mol Sci. 2019. PMID: 31540361 Free PMC article. Review.
-
Mesenchymal Stromal Cell Therapy in Ischemia/Reperfusion Injury.J Immunol Res. 2015;2015:602597. doi: 10.1155/2015/602597. Epub 2015 Jul 15. J Immunol Res. 2015. PMID: 26258151 Free PMC article. Review.
-
Mesenchymal Stem/Stromal Cells in Organ Transplantation.Pharmaceutics. 2022 Apr 4;14(4):791. doi: 10.3390/pharmaceutics14040791. Pharmaceutics. 2022. PMID: 35456625 Free PMC article. Review.
-
Stem/Stromal Cells for Treatment of Kidney Injuries With Focus on Preclinical Models.Front Med (Lausanne). 2018 Jun 15;5:179. doi: 10.3389/fmed.2018.00179. eCollection 2018. Front Med (Lausanne). 2018. PMID: 29963554 Free PMC article. Review.
References
-
- Dominici M, Le Blanc K, Mueller I, Slaper-Cortenbach I, Marini F, Krause D, Deans R, Keating A, Prockop D, Horwitz E. Minimal criteria for defining multipotent mesenchymal stromal cells. The international society for cellular therapy position statement. Cytotherapy. 2006;8:315–317. doi: 10.1080/14653240600855905. - DOI - PubMed
-
- Pittenger MF, Mackay AM, Beck SC, Jaiswal RK, Douglas R, Mosca JD, Moorman MA, Simonetti DW, Craig S, Marshak DR. Multilineage potential of adult human mesenchymal stem cells. Science. 2006;284:43–147. - PubMed
MeSH terms
Substances
LinkOut - more resources
Full Text Sources
Other Literature Sources
Medical
Molecular Biology Databases
Research Materials
Miscellaneous
