. 2014 Oct;22(10):1419-28.
doi: 10.1016/j.joca.2014.07.014.

Rapid, automated imaging of mouse articular cartilage by microCT for early detection of osteoarthritis and finite element modelling of joint mechanics

Affiliations

Rapid, automated imaging of mouse articular cartilage by microCT for early detection of osteoarthritis and finite element modelling of joint mechanics

P Das Neves Borges et al. Osteoarthritis Cartilage. 2014 Oct.

Abstract

Objective: Mouse articular cartilage (AC) is mostly assessed by histopathology and its mechanics is poorly characterised. In this study: (1) we developed non-destructive imaging for quantitative assessment of AC morphology and (2) evaluated the mechanical implications of AC structural changes.

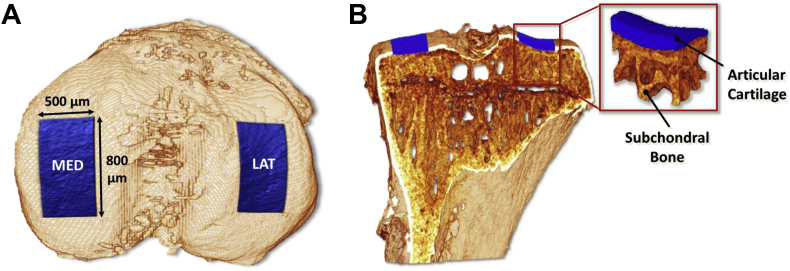
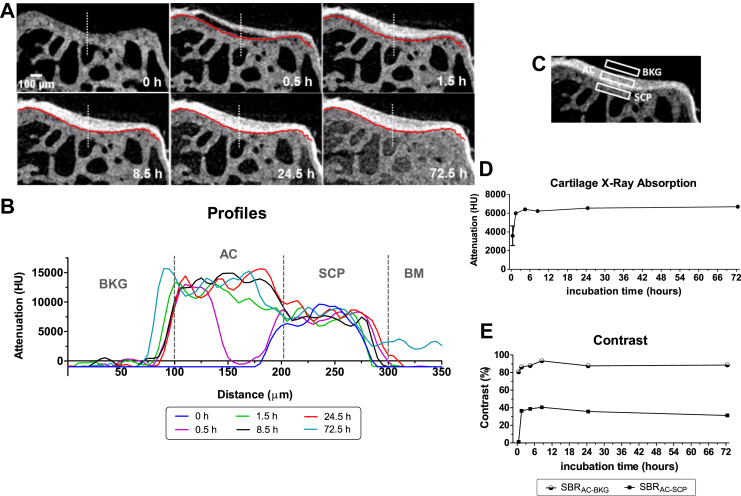
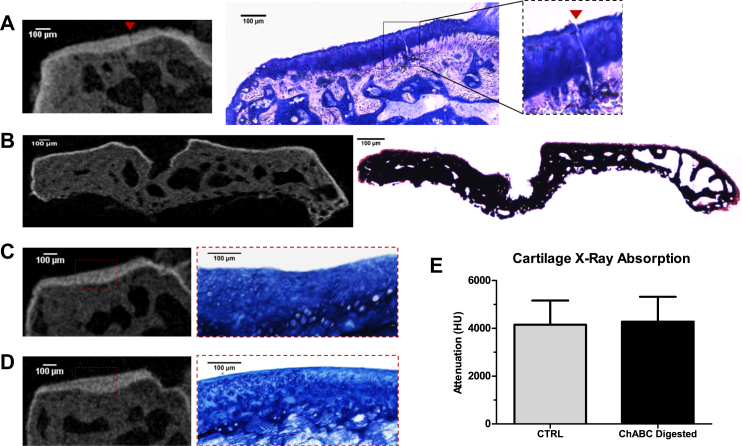
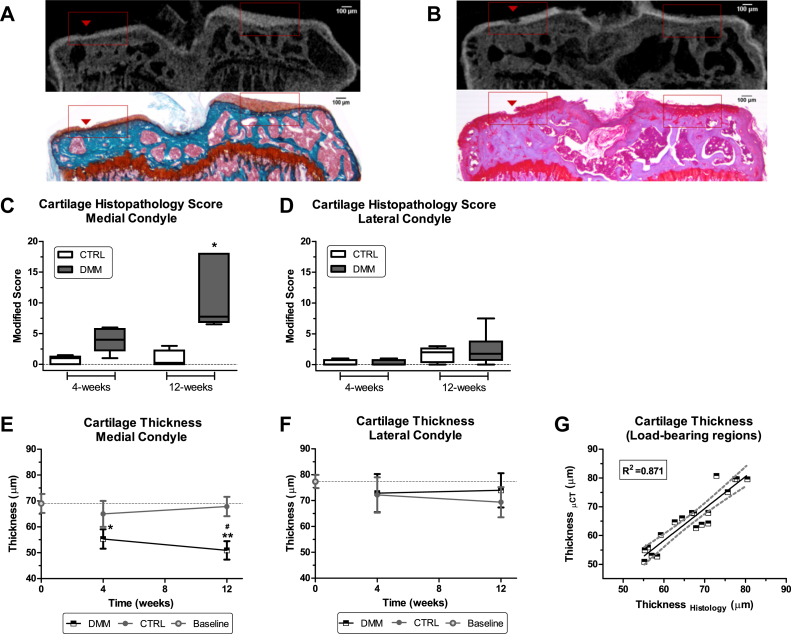
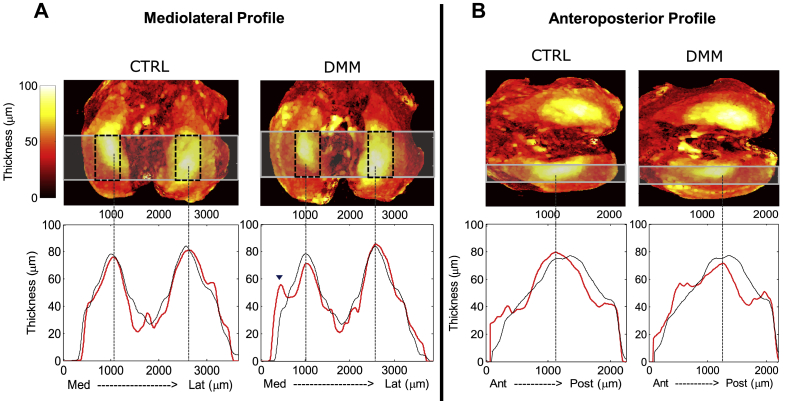
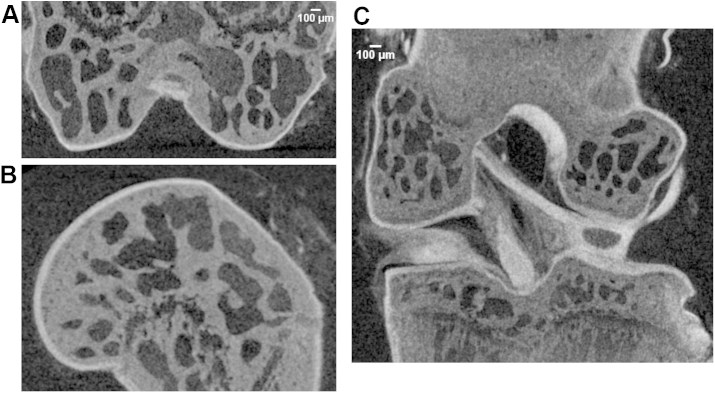
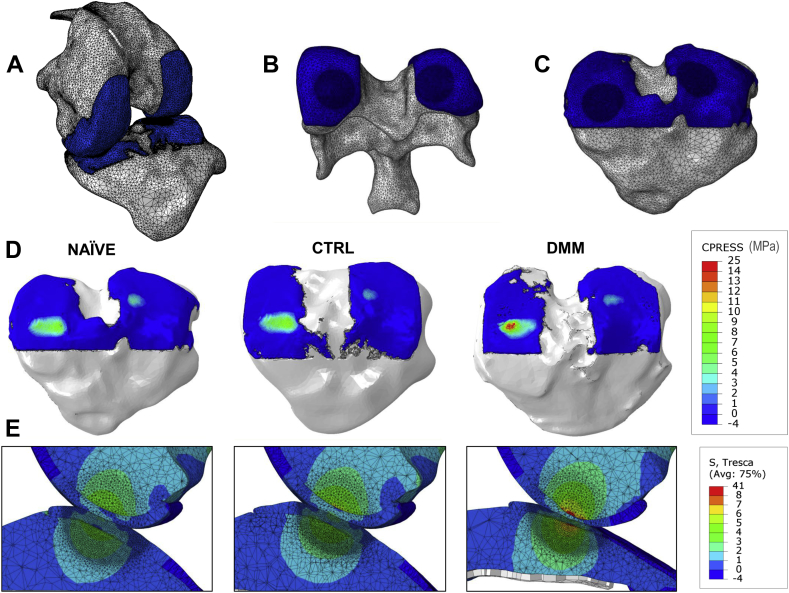
Methods: Knee joints obtained from naïve mice and from mice with osteoarthritis (OA) induced by destabilization of medial meniscus (DMM) for 4 and 12 weeks, were imaged by phosphotungstic acid (PTA) contrast enhanced micro-computed tomography (PTA-CT) and scored by conventional histopathology. Our software (Matlab) automatically segmented tibial AC, drew two regions centred on each tibial condyle and evaluated the volumes included. A finite element (FE) model of the whole mouse joint was implemented to evaluate AC mechanics.

Results: Our method achieved rapid, automated analysis of mouse AC (structural parameters in <10 h from knee dissection) and was able to localise AC loss in the central region of the medial tibial condyle. AC thickness decreased by 15% at 4 weeks and 25% at 12 weeks post DMM surgery, whereas histopathology scores were significantly increased only at 12 weeks. FE simulations estimated that AC thinning at early-stages in the DMM model (4 weeks) increases contact pressures (+39%) and Tresca stresses (+43%) in AC.

Conclusion: PTA-CT imaging is a fast and simple method to assess OA in murine models. Once applied more extensively to confirm its robustness, our approach will be useful for rapidly phenotyping genetically modified mice used for OA research and to improve the current understanding of mouse cartilage mechanics.

Keywords: 3-dimensional quantitative imaging; Destabilisation of medial meniscus model; High-throughput automated image analysis; Micro computed tomography; Mouse articular cartilage.


Figures

Fig. 1
Fig. 1
Automated mapping of ROIs generated by Matlab software on the load bearing regions on the tibial condyles. A, Top view of a 3D rendering of mouse tibia obtained by PTA-CT showing the ROIs in the medial and lateral condyles of the tibia, extending 800 μm by 500 μm. B, Coronal view of (A) and magnification of one ROI including the AC layer (coloured in blue) and extending down to the underlying subchondral mineralised plate (made of calcified cartilage and cortical bone) and subchondral trabecular bone.
Fig. 2
Fig. 2
A, Representative coronal views of the lateral condyle of a mouse tibia imaged by microCT showing the uptake of PTA over time (n = 3). The red line contouring the tidemark (uncalcified–calcified cartilage boundary) was manually drawn on the first time point (at 0.5 h) and copied across on all subsequent time points to better visualise PTA diffusion beyond the tidemark. The leftmost panel shows the same view of the lateral condyle before PTA was added in the sample holder within the microCT scanner. Note that soft tissue is undetectable without contrast agent. B, Representative profiles of grey levels along the white dotted line shown on each coronal image in (A). Each profile represents an incubation time point (in PTA solution). Transitions between BKG and AC, AC and SCP, SCP and BM are marked on the profiles by grey dotted lines. C, Representative coronal view of the lateral condyle of a mouse tibia showing the three ROIs AC, BKG and SCP used to measure X-ray absorption (reported as HU levels for each ROI) and related contrasts. D, Representative time course of X-ray absorption of AC as a function of PTA incubation time (n = 3). E, Representative time course of SBR – a quantitative measure of the contrast achieved by an area of interest within an image – over PTA incubation time. SBR was computed for AC vs BKG (SBRAC−BKG) as well as for AC vs SCP (SBRAC−SCP). PTA uptake time course up to 72 h evaluated in one sample and up to 24 h evaluated in three samples (from naïve mice). Finally the 24 h time point uptake was evaluated in 12 samples (all the naïve samples).
Fig. 3
Fig. 3
Visualisation of mechanically or chemically damaged cartilage by PTA-CT. A, Representative PTA-CT coronal view of a medial tibial condyle scarified using a surgical scalpel (n = 2), and correspondent histological section (undecalcified) stained with toluidine blue, showing a deep cut (red arrow) extending from the AC surface to the SCP. Note the diffusion of PTA below the tidemark only locally around the zone of the cut. B, Representative PTA-CT coronal view of a tibial epiphysis after 24 h digestion in papain protease (n = 2) and correspondent histological section (undecalcified) stained with Von Kossa/safranin-o. A thin layer of stained material above the mineralised tissue – likely to be cartilage debris of the enzymatic digestion – is visible on the surface of the SCP in both images. C–D, Representative coronal views of the medial condyles from a pair of untreated (C) or ChABC treated (D) tibiae (n = 3) and correspondent histological sections stained with toluidine blue. The AC of the treated samples appeared discoloured compared with untreated AC – showing the expected loss of sGAGs induced by chondroitinase digestion. However, no qualitative changes between treated vs untreated samples were observed in the PTA-CT imaging. (E) Bar graph showing the X-ray absorption of AC (expressed as mean HU level of the red dashed ROI) in treated and untreated groups – no statistically significant changes were found (n = 3).
Fig. 4
Fig. 4
Automated assessment of AC in the DMM model and histological validation. A–B, Representative coronal views of a DMM tibia at 4 weeks (A) and 12 weeks (B) post surgery imaged by PTA-CT and correspondent histological section stained with safranin-o (contrasted with fast green in A or with haematoxylin in B). Note that a small lesions on the medial AC (red arrow head) are visible in the PTA-CT image and are well matched in the histological sections. C–D, Boxplot charts of the modified histopathology OARSI score for the CTRL and DMM joints at 4 and 12 weeks post DMM surgery. Data were grouped into medial and lateral. The median score of the medial side of the DMM was elevated compared with the CTRL at 4 weeks, although borderline significant (P = 0.06, n = 5, Wilcoxon signed rank test) and further increased at 12 weeks (P = 0.035, n = 4). E–F, Line charts of AC average thickness measured automatically from the volumes contained in the ROIs obtained from segmented PTA-CT scans of CTRL and DMM joints at 4 and 12 weeks post DMM surgery. Data grouped into medial and lateral. Symbols represent the means and error bars show 95% CI (n = 4 for experimental groups and n = 6 for naïve mice used as baseline). *P < 0.05 and **P < 0.01 for DMM vs CTRL by paired, two-tailed Student's t test; #P < 0.05 for 4-weeks DMM vs 12-weeks DMM by unpaired, two-tailed Student's t test. G, Correlation graph for AC thickness in PTA-CT and histological images (includes 4- and 12-week CTRL and DMM samples, n = 19). AC thickness was measured in the load-bearing regions (delimited by the red ROIs in A–B) from both methods. The coefficient of determination R2, obtained from the linear regression, is reported on the graph.
Fig. 5
Fig. 5
Thickness heat maps of AC obtained from PTA-CT datasets of the 4-weeks DMM group (CTRL and DMM side). A–B, Mediolateral (A) and medial anteroposterior (B) thickness maps of the AC for a representative pair of CTRL and DMM tibiae. Below each panel the red profiles show the changes in thickness along the horizontal bars highlighted on the maps (each profile is the average of four samples). Thickness profiles of naïve mice (n = 6) are displayed in black (maps not shown for naïve mice). The position of the automated ROIs on the maps is indicated by dashed squares. Note that the peak thickness fall in the automated ROIs and is markedly decreased 12 weeks post DMM surgery. The arrow head shows a second peak in AC thickness in the mediolateral DMM profile, presumably due to the newly formed cartilage covering a medial osteophyte.
Fig. 6
Fig. 6
A–B, Representative PTA-CT images of a mouse distal femur displayed in coronal (A) and sagittal (B) views. C, Representative PTA-CT image showing a coronal view of a whole, intact mouse knee joint.
Fig. 7
Fig. 7
FE analysis of the mechanical stresses in AC caused by the structural changes induced by DMM surgery. A–C, model of the whole knee joint at 80° flexion (A); mesh structure and high density contact areas (darker blue) of the AC covering the (naïve) distal femur (B) and the (naïve) proximal tibia (C). D, Contact pressure maps on the surface of the AC of the three tibiae (naïve, CTRL and DMM) used in the FE simulations. E, Sagittal view of the distribution of Tresca stresses in the three modelled joints (naïve, CTRL and DMM tibiae loaded by the same naïve femur) at the end of the FE simulations.

References

    1. Glasson S.S. In vivo osteoarthritis target validation utilizing genetically-modified mice. Curr Drug Targets. 2007;8(2):367–376. - PubMed
    1. Poulet B., Westerhof T.A.T., Hamilton R.W., Shefelbine S.J., Pitsillides A.A. Spontaneous osteoarthritis in Str/ort mice is unlikely due to greater vulnerability to mechanical trauma. Osteoarthritis Cartilage. 2013;21(5):756–763. - PubMed
    1. Vincent T.L., Williams R.O., Maciewicz R., Silman A., Garside P., Arthritis research UK animal models working group Mapping pathogenesis of arthritis through small animal models. Rheumatology (Oxford) 2012;51(11):1931–1941. - PubMed
    1. Eckstein F., Guermazi A., Roemer F.W. Quantitative MR imaging of cartilage and trabecular bone in osteoarthritis. Radiol Clin North Am. 2009;47(4):655–673. - PubMed
    1. Hunter D.J., Zhang W., Conaghan P.G., Hirko K., Menashe L., Reichmann W.M. Responsiveness and reliability of MRI in knee osteoarthritis: a meta-analysis of published evidence. Osteoarthritis Cartilage. 2011;19(5):589–605. - PMC - PubMed

Publication types

MeSH terms