

Item response theory-based measure of global disability in multiple sclerosis derived from the Performance Scales and related items
- PMID: 25278315
- PMCID: PMC4195863
- DOI: 10.1186/s12883-014-0192-1
Item response theory-based measure of global disability in multiple sclerosis derived from the Performance Scales and related items
Abstract
Background: The eight Performance Scales and three assimilated scales (PS) used in North American Research Committee on Multiple Sclerosis (NARCOMS) registry surveys cover a broad range of neurologic domains commonly affected by multiple sclerosis (mobility, hand function, vision, fatigue, cognition, bladder/bowel, sensory, spasticity, pain, depression, and tremor/coordination). Each scale consists of a single 6-to-7-point Likert item with response categories ranging from "normal" to "total disability". Relatively little is known about the performances of the summary index of disability derived from these scales (the Performance Scales Sum or PSS). In this study, we demonstrate the value of a combination of classical and modern methods recently proposed by the Patient-Reported Outcome Measurement Information System (PROMIS) network to evaluate the psychometric properties of the PSS and derive an improved measure of global disability from the PS.
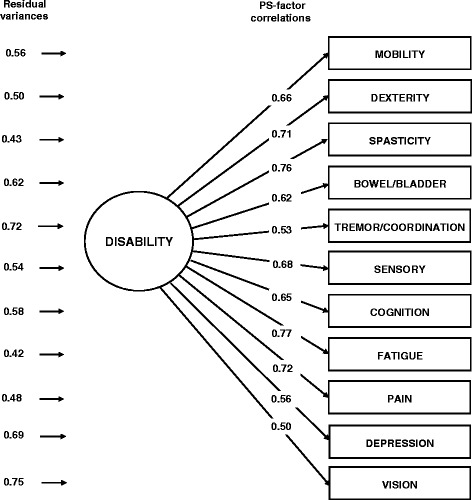
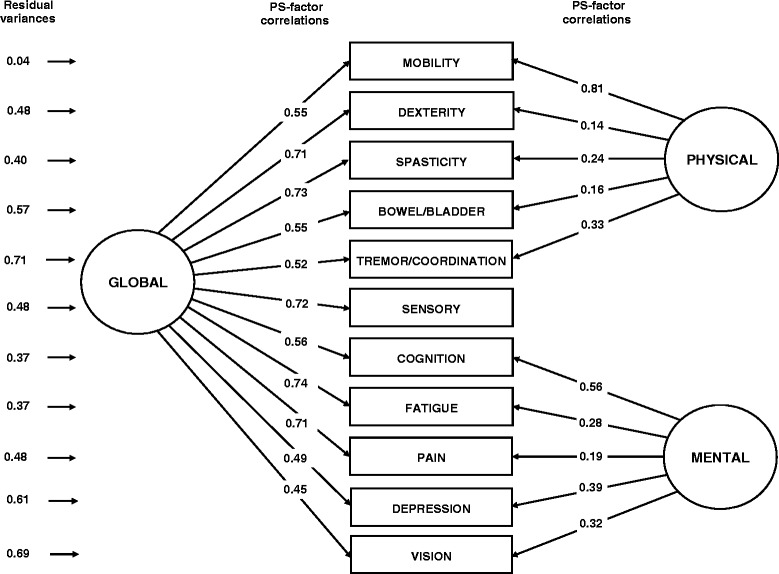
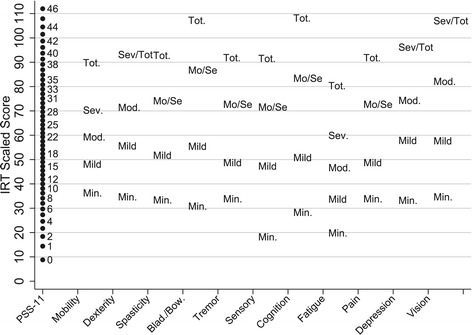
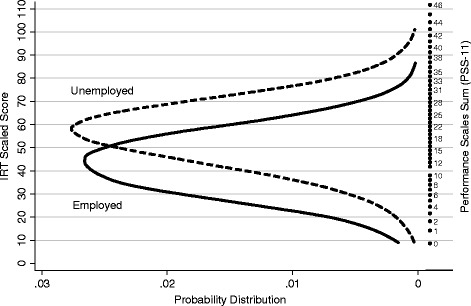
Methods: The study sample included 7,851adults with MS who completed a NARCOMS intake questionnaire between 2003 and 2011. Factor analysis, bifactor modeling, and item response theory (IRT) analysis were used to evaluate the dimension(s) of disability underlying the PS; calibrate the 11 scales; and generate three alternative summary scores of global disability corresponding to different model assumptions and practical priorities. The construct validity of the three scores was compared by examining the magnitude of their associations with participant's background characteristics, including unemployment.
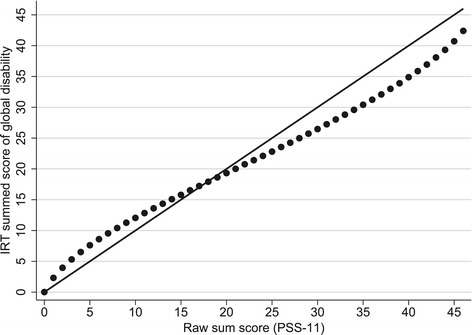
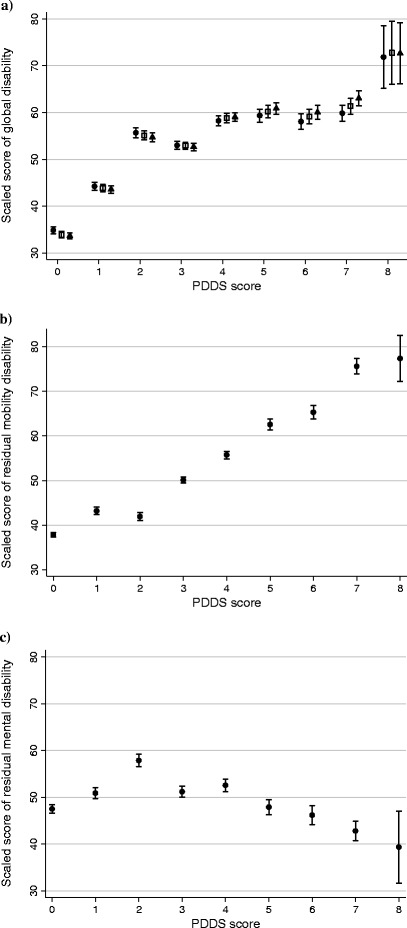
Results: We derived structurally valid measures of global disability from the PS through the proposed methodology that were superior to the PSS. The measure most applicable to clinical practice gives similar weight to physical and mental disability. Overall reliability of the new measure is acceptable for individual comparisons (0.87). Higher scores of global disability were significantly associated with older age at assessment, longer disease duration, male gender, Native-American ethnicity, not receiving disease modifying therapy, unemployment, and higher scores on the Patient Determined Disease Steps (PDDS).
Conclusion: Promising, interpretable and easily-obtainable IRT scores of global disability were generated from the PS by using a sequence of traditional and modern psychometric methods based on PROMIS recommendations. Our analyses shed new light on the construct of global disability in MS.
Figures
Similar articles
-
Fatigue characteristics in multiple sclerosis: the North American Research Committee on Multiple Sclerosis (NARCOMS) survey.Health Qual Life Outcomes. 2008 Nov 14;6:100. doi: 10.1186/1477-7525-6-100. Health Qual Life Outcomes. 2008. PMID: 19014588 Free PMC article.
-
The symptom inventory disability-specific short forms for multiple sclerosis: reliability and factor structure.Arch Phys Med Rehabil. 2012 Sep;93(9):1629-1636.e2. doi: 10.1016/j.apmr.2012.03.006. Epub 2012 Mar 21. Arch Phys Med Rehabil. 2012. PMID: 22446293
-
Reliability and validity of two self-report measures of impairment and disability for MS. North American Research Consortium on Multiple Sclerosis Outcomes Study Group.Neurology. 1999 Jan 1;52(1):63-70. doi: 10.1212/wnl.52.1.63. Neurology. 1999. PMID: 9921850
-
Improving the evaluation of therapeutic interventions in multiple sclerosis: development of a patient-based measure of outcome.Health Technol Assess. 2004 Mar;8(9):iii, 1-48. doi: 10.3310/hta8090. Health Technol Assess. 2004. PMID: 14982653 Review.
-
Improving the evaluation of therapeutic interventions in multiple sclerosis: the role of new psychometric methods.Health Technol Assess. 2009 Feb;13(12):iii, ix-x, 1-177. doi: 10.3310/hta13120. Health Technol Assess. 2009. PMID: 19216837 Review.
Cited by
-
Spatial and temporal distribution of the prevalence of unemployment and early retirement in people with multiple sclerosis: A systematic review with meta-analysis.PLoS One. 2022 Jul 28;17(7):e0272156. doi: 10.1371/journal.pone.0272156. eCollection 2022. PLoS One. 2022. PMID: 35901070 Free PMC article.
-
Depression and Age at First Neurology Appointment Associated with Receipt of Behavioral Medicine Services Within 1 Year in a Multiple Sclerosis Population.Int J MS Care. 2017 Jul-Aug;19(4):199-207. doi: 10.7224/1537-2073.2016-012. Int J MS Care. 2017. PMID: 28835744 Free PMC article.
-
Viability of a MSQOL-54 general health-related quality of life score using bifactor model.Health Qual Life Outcomes. 2021 Sep 25;19(1):224. doi: 10.1186/s12955-021-01857-y. Health Qual Life Outcomes. 2021. PMID: 34563229 Free PMC article.
-
Associations between smoking and walking, fatigue, depression, and health-related quality of life in persons with multiple sclerosis.Acta Neurol Belg. 2021 Oct;121(5):1199-1206. doi: 10.1007/s13760-020-01341-2. Epub 2020 Mar 28. Acta Neurol Belg. 2021. PMID: 32222910
-
Multiple sclerosis subgroups: Data-driven clusters based on patient-reported outcomes and a large clinical sample.Mult Scler. 2024 Nov;30(13):1642-1652. doi: 10.1177/13524585241282763. Epub 2024 Oct 17. Mult Scler. 2024. PMID: 39420575 Free PMC article.
References
-
- Marrie RA, Cutter G, Tyry T, Campagnolo D, Vollmer T. Validation of NARCOMS Depression Scale. Int J MS Care. 2008;10:81–84. doi: 10.7224/1537-2073-10.3.81. - DOI
Publication types
MeSH terms
LinkOut - more resources
Full Text Sources
Other Literature Sources
