. 2014 Oct 3;346(6205):56-61.
doi: 10.1126/science.1256739. Epub 2014 Oct 2.

HIV epidemiology. The early spread and epidemic ignition of HIV-1 in human populations

Affiliations

HIV epidemiology. The early spread and epidemic ignition of HIV-1 in human populations

Nuno R Faria et al. Science. .

Abstract

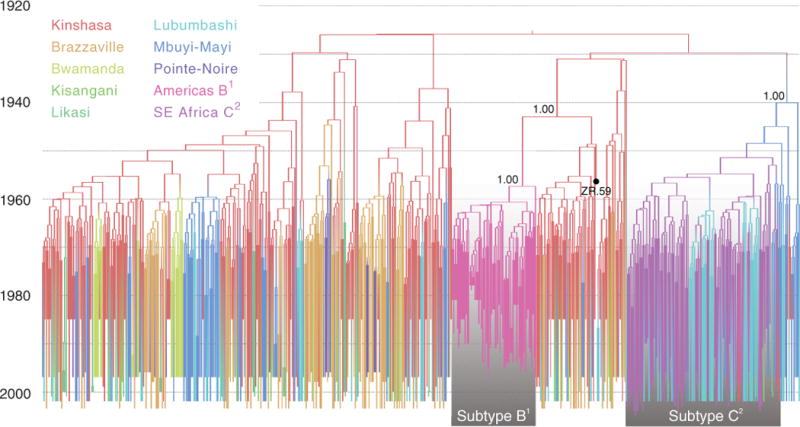
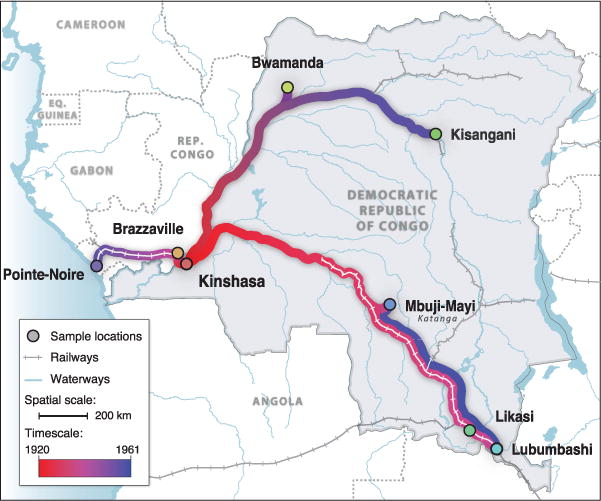
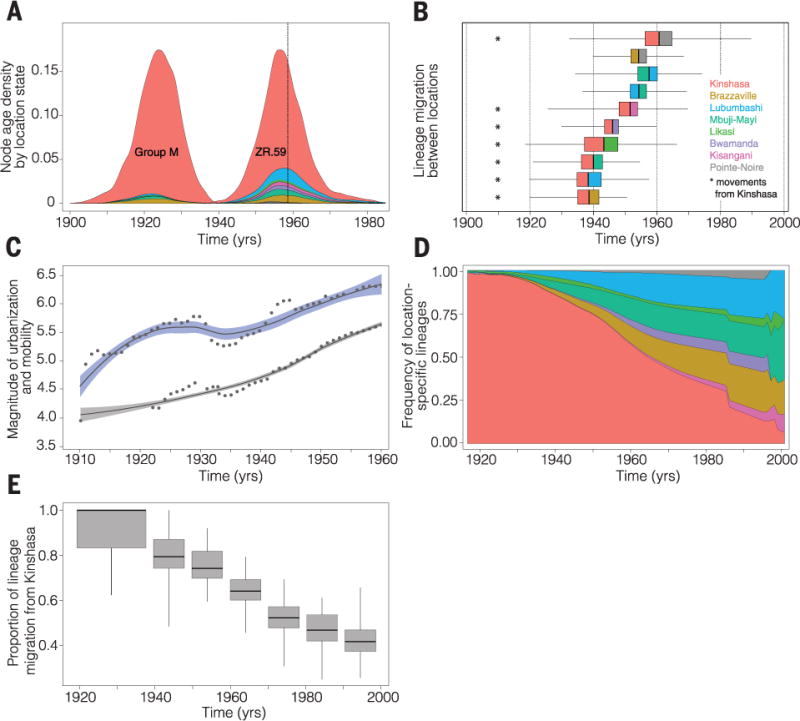
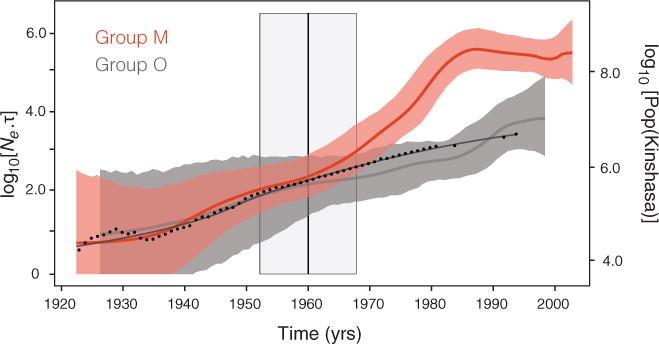
Thirty years after the discovery of HIV-1, the early transmission, dissemination, and establishment of the virus in human populations remain unclear. Using statistical approaches applied to HIV-1 sequence data from central Africa, we show that from the 1920s Kinshasa (in what is now the Democratic Republic of Congo) was the focus of early transmission and the source of pre-1960 pandemic viruses elsewhere. Location and dating estimates were validated using the earliest HIV-1 archival sample, also from Kinshasa. The epidemic histories of HIV-1 group M and nonpandemic group O were similar until ~1960, after which group M underwent an epidemiological transition and outpaced regional population growth. Our results reconstruct the early dynamics of HIV-1 and emphasize the role of social changes and transport networks in the establishment of this virus in human populations.


Conflict of interest statement

We declare no competing financial interests.

Figures

Fig. 1
Fig. 1. Time-scaled phylogeographic history of pandemic HIV-1
Branch colors represent the most probable location of the parental node of each branch. The respective colors for each location are shown in the upper left. U.S./Haiti/Trinidad subtype B and southeast African subtype C lineages are highlighted by boxes with a gradient shading, along with the posterior probabilities for their ancestral nodes. The tip for the ZR59 sequence is highlighted with a black circle.
Fig. 2
Fig. 2. Spatial dynamics of HIV-1 group M spread
Circles represent sampled locations and are colored according to the estimated time of introduction of HIV-1 group M from Kinshasa. Strongly supported rates of virus spatial movement (table S6) are projected along the transportation network for the DRC (railways and waterways), which was fully operational until 1960 (38). Gradient colors depict the time scale of spatial movements (bottom left).
Fig. 3
Fig. 3. HIV-1 group M establishment, human mobility, and urbanization
(A) Posterior probability densities for the estimated age of the most recent common ancestor of HIV-1 group M and of the archival ZR59 sequence. Distributions are stratified according to the estimated locations of both nodes (location-specific colors correspond to those in Fig. 1). A vertical dotted line shows the known sampling date for ZR59 (1959). (B) Earliest dates of lineage migration for significant routes of group M dispersal in the DRC and RC (table S6). Each box-and-whisker plot represents movement between a pair of locations. The vertical bar in each box represents the earliest date of movement, and colors to the left and right of this bar represent the seeding and receiving locations, respectively. The width of the boxes and the whiskers represents the 25-to-75% and 2.5-to-97.5% percentiles, respectively, of the estimated date of earliest movement. (C) Locally weighted regression curves for the official total number of passengers (log10) transported along railways (95% of journeys) and waterways (5%) in the DRC (38) (blue) and for the human population size (log10) of Kinshasa (gray) between 1900 and 1960 (43), after which reliable transportation data are unavailable. Dots show regression data points. (D) Estimated frequency of group M lineages at each location in the DRC and RC through time. (E) Estimated proportion of all migration events that began in Kinshasa until 1940 and, per decade, between 1940 and 2000. [Box-and-whisker widths are defined in (B).] This percentage drops to 43.5% between 1990 and 2000 (fig. S6 shows the estimated proportion of movement events originating from each location).
Fig. 4
Fig. 4. Population dynamics of HIV-1 groups M and O
Bayesian skygrid estimates of past population dynamics for group M (red) and group O (gray) (30). The left y axis represents the effective number of infections (Ne) multiplied by the mean viral generation time (τ). Group O dynamics were obtained using the same best-fitting demographic model as for group M (table S7), applied to an alignment of 50 concatenated gag, pol, and env sequences sampled between 1987 and 1999 from west-central African patients (62). The superimposed black curve represents a locally weighted regression of human population growth in Kinshasa between 1920 and 1994 (43, 64). Dots show regression data points. The vertical line at 1960 corresponds to the estimated time at which group M transitioned from slow to faster exponential growth. The 95% BCI for this estimate is highlighted in gray.

Comment in

References

    1. UNAIDS. Global Reports – UNAIDS report on the global AIDS epidemic 2013. UNAIDS; Geneva: 2013.
    1. Gottlieb MS, Schanker MD, Fan PT, Saxon MD, Weisman JD, Centers for Disease Control (CDC) MMWR Morb Mortal Wkly Rep. 1981;30:250–252. - PubMed
    1. Barré-Sinoussi F, et al. Science. 1983;220:868–871. - PubMed
    1. Gallo RC, et al. Science. 1983;220:865–867. - PubMed
    1. Piot P, et al. Lancet. 1984;2:65–69. - PubMed

Publication types

MeSH terms