

Improved prediction of tacrolimus concentrations early after kidney transplantation using theory-based pharmacokinetic modelling
- PMID: 25279405
- PMCID: PMC4243902
- DOI: 10.1111/bcp.12361
Improved prediction of tacrolimus concentrations early after kidney transplantation using theory-based pharmacokinetic modelling
Abstract
Aims: The aim was to develop a theory-based population pharmacokinetic model of tacrolimus in adult kidney transplant recipients and to externally evaluate this model and two previous empirical models.
Methods: Data were obtained from 242 patients with 3100 tacrolimus whole blood concentrations. External evaluation was performed by examining model predictive performance using Bayesian forecasting.
Results: Pharmacokinetic disposition parameters were estimated based on tacrolimus plasma concentrations, predicted from whole blood concentrations, haematocrit and literature values for tacrolimus binding to red blood cells. Disposition parameters were allometrically scaled to fat free mass. Tacrolimus whole blood clearance/bioavailability standardized to haematocrit of 45% and fat free mass of 60 kg was estimated to be 16.1 l h−1 [95% CI 12.6, 18.0 l h−1]. Tacrolimus clearance was 30% higher (95% CI 13, 46%) and bioavailability 18% lower (95% CI 2, 29%) in CYP3A5 expressers compared with non-expressers. An Emax model described decreasing tacrolimus bioavailability with increasing prednisolone dose. The theory-based model was superior to the empirical models during external evaluation displaying a median prediction error of −1.2% (95% CI −3.0, 0.1%). Based on simulation, Bayesian forecasting led to 65% (95% CI 62, 68%) of patients achieving a tacrolimus average steady-state concentration within a suggested acceptable range.
Conclusion: A theory-based population pharmacokinetic model was superior to two empirical models for prediction of tacrolimus concentrations and seemed suitable for Bayesian prediction of tacrolimus doses early after kidney transplantation.
Figures
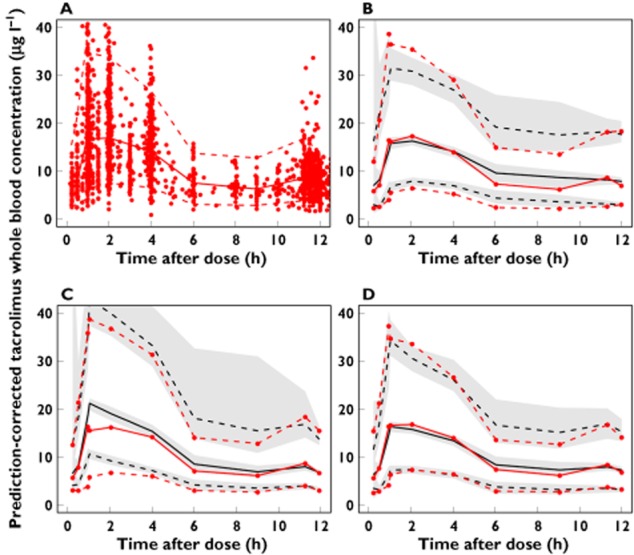
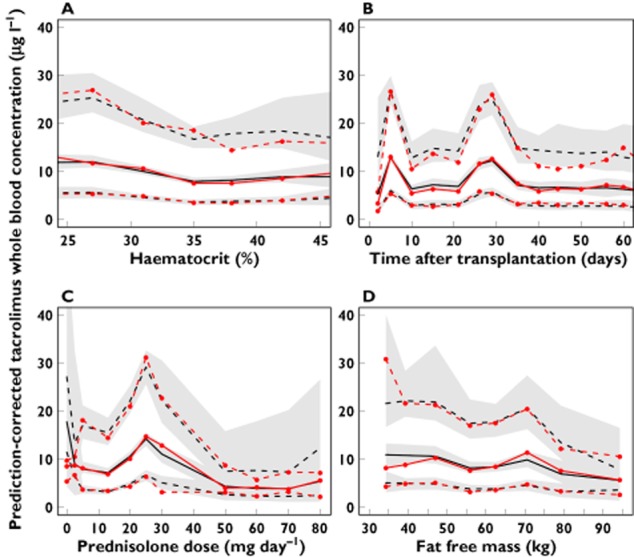
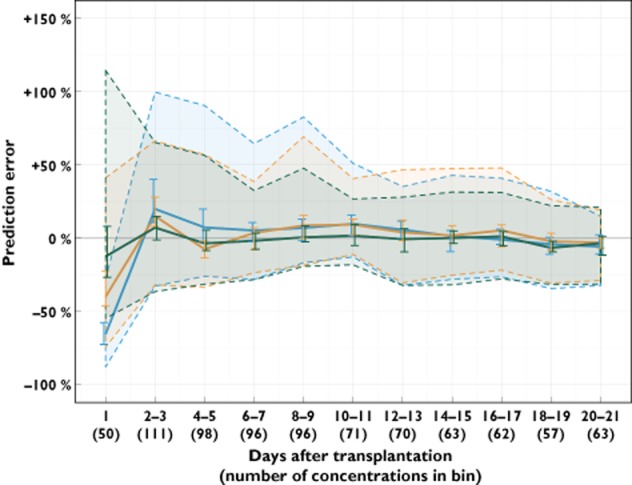
 ) Brisbane model, (
 ) Oslo model, (
 ) theory-based model
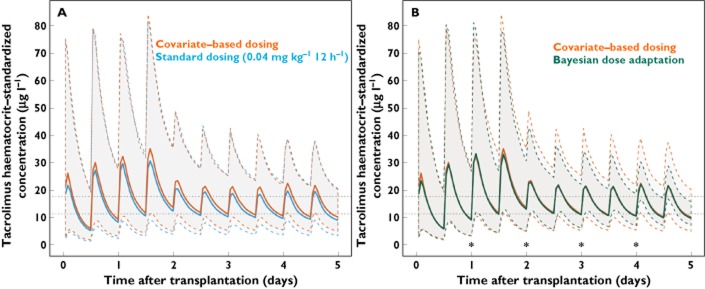
References
-
- Staatz CE, Tett SE. Clinical pharmacokinetics and pharmacodynamics of tacrolimus in solid organ transplantation. Clin Pharmacokinet. 2004;43:623–653. - PubMed
-
- Wallemacq P, Armstrong VW, Brunet M, Haufroid V, Holt DW, Johnston A, Kuypers D, Le Meur Y, Marquet P, Oellerich M, Thervet E, Toenshoff B, Undre N, Weber LT, Westley IS, Mourad M. Opportunities to optimize tacrolimus therapy in solid organ transplantation: report of the European consensus conference. Ther Drug Monit. 2009;31:139–152. - PubMed
-
- Saint-Marcoux F, Woillard J-B, Jurado C, Marquet P. Lessons from routine dose adjustment of tacrolimus in renal transplant patients based on global exposure. Ther Drug Monit. 2013;35:322–327. - PubMed
-
- Sheiner LB, Beal S, Rosenberg B, Marathe VV. Forecasting individual pharmacokinetics. Clin Pharmacol Ther. 1979;26:294–305. - PubMed
-
- Staatz CE, Tett SE. Maximum a posteriori Bayesian estimation of mycophenolic acid area under the concentration-time curve: is this clinically useful for dosage prediction yet? Clin Pharmacokinet. 2011;50:759–772. - PubMed
Publication types
MeSH terms
Substances
LinkOut - more resources
Full Text Sources
Other Literature Sources
Medical
Molecular Biology Databases
