. 2014 Sep 26:8:111.
doi: 10.1186/s12918-014-0111-5.

Integration of heterogeneous molecular networks to unravel gene-regulation in Mycobacterium tuberculosis

Integration of heterogeneous molecular networks to unravel gene-regulation in Mycobacterium tuberculosis

Jesse C J van Dam et al. BMC Syst Biol. .

Abstract

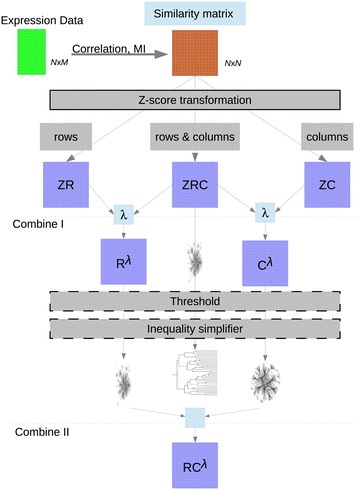
Background: Different methods have been developed to infer regulatory networks from heterogeneous omics datasets and to construct co-expression networks. Each algorithm produces different networks and efforts have been devoted to automatically integrate them into consensus sets. However each separate set has an intrinsic value that is diluted and partly lost when building a consensus network. Here we present a methodology to generate co-expression networks and, instead of a consensus network, we propose an integration framework where the different networks are kept and analysed with additional tools to efficiently combine the information extracted from each network.

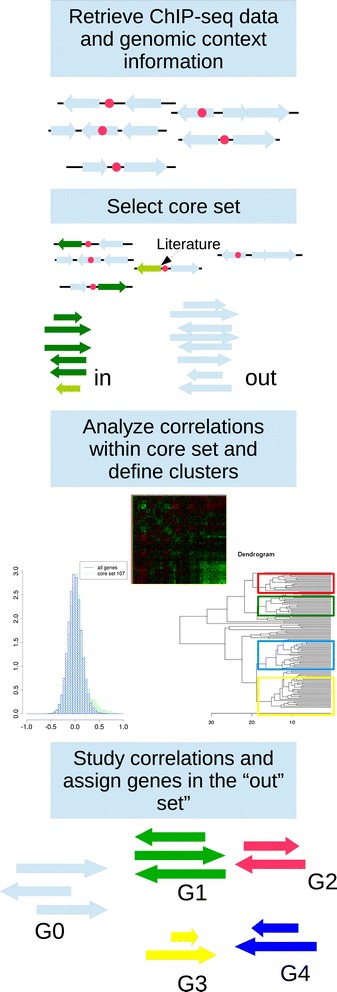
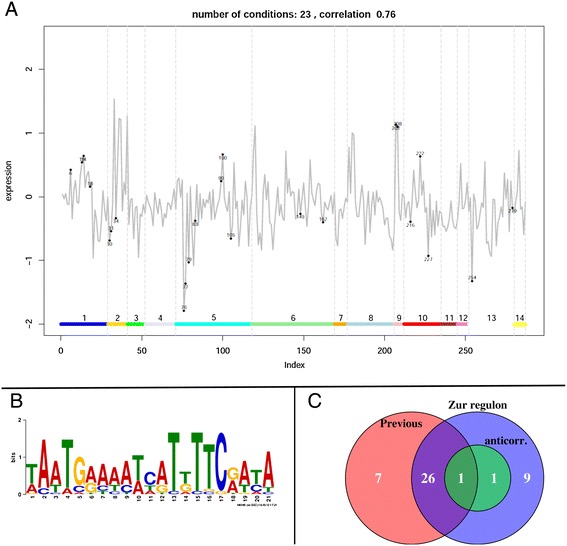
Results: We developed a workflow to efficiently analyse information generated by different inference and prediction methods. Our methodology relies on providing the user the means to simultaneously visualise and analyse the coexisting networks generated by different algorithms, heterogeneous datasets, and a suite of analysis tools. As a show case, we have analysed the gene co-expression networks of Mycobacterium tuberculosis generated using over 600 expression experiments. Regarding DNA damage repair, we identified SigC as a key control element, 12 new targets for LexA, an updated LexA binding motif, and a potential mismatch repair system. We expanded the DevR regulon with 27 genes while identifying 9 targets wrongly assigned to this regulon. We discovered 10 new genes linked to zinc uptake and a new regulatory mechanism for ZuR. The use of co-expression networks to perform system level analysis allows the development of custom made methodologies. As show cases we implemented a pipeline to integrate ChIP-seq data and another method to uncover multiple regulatory layers.

Conclusions: Our workflow is based on representing the multiple types of information as network representations and presenting these networks in a synchronous framework that allows their simultaneous visualization while keeping specific associations from the different networks. By simultaneously exploring these networks and metadata, we gained insights into regulatory mechanisms in M. tuberculosis that could not be obtained through the separate analysis of each data type.


Figures

Figure 1
Figure 1
Schematic of the pipeline to obtain co-expression networks. From top to bottom the following steps are applied: (1) calculation of the similarity matrix, (2) z-transformation, (3) Combine I, (4) threshold setting (5) inequality simplifier and (6) combine II. Note that when applying the Inequality simplifier to the ZRC network the result will be a tree.
Figure 2
Figure 2
Pipeline to uncover additional regulatory layers. Step 1: Identify conditions linked to the main regulatory event for the initial gene set. This can be done using biclustering techniques or by direct comparison with the expression levels of the regulator (if known). Step 2: Build co-expression networks in the remaining conditions. Step 3: Identify the closest neighbours of the selected genes in the new networks. Step 4: iterative round of motif identification/matching to identify the secondary motif and the set of genes with this motif in their upstream regions.
Figure 3
Figure 3
Pipeline to analyze ChIP-seq data. After the locations of the ChIP-seq binding sites have been retrieved, their genomic context is analysed. A core set is defined by selecting targets with i) literature evidence or ii) a hit in the upstream region of not divergently transcribed genes. The expression levels of these genes are analysed and they are categorized through (bi)clustering. Finally the rest of the putative targets are assigned to these groups (if possible) based on the similarities of their expression patterns.
Figure 4
Figure 4
The inequality simplifier. The similarity values among the nodes (genes) connected by the different edges have been indicated. Dotted lines represent the spurious links removed by the inequality simplifier. Left application of order two, which is equivalent to a direct application of the DPI. Right higher order application, both dotted lines are removed. The DPI would only remove the blue dotted line.
Figure 5
Figure 5
Topological overlap of TF targets in the E. coli ZRC co-expression network. The ZRC co-expression network was reconstructed using our pipeline using E. coli expression data from the DREAM5 challenge [15]. Only the 67 TF with more than 5 experimentally verified targets (in the gold standard) were considered. Dashed line represents the average topological overlap in this network (0.0053).
Figure 6
Figure 6
LexA regulon. A) Plot of the average expression level of the members of the LexA regulon across the different conditions. Red dots mark conditions with high (>0.8) correlation between the genes in LexA regulon. The horizontal bar and its different regions indicated by numbers refer to the classification of the conditions as described in Materials and Methods. High expression levels are observed in conditions corresponding to low pH or UV light. B) Clusters of genes involved in DNA repair mechanisms in the co-expression network (obtained from the combination of R λ and C λ with λ = √2). Genes regulated by LexA are marked red. C) Refined LexA identified binding motif, positions 14 and 15 were previously non specific. D) Number of genes identified to be regulated by LexA. Previous indicates genes previously reported in the literature as LexA regulated [65], whereas Automatic refers to the genes initially identified by the automatic biclustering algorithm.
Figure 7
Figure 7
DevR regulon. A) Left: Histogram in blue represents the correlation among all the genes present in our compendium, whereas the histogram in green is based upon the correlations of the identified targets for which expression data is available within our compendium (605). Both show the same overall distribution. Right: Histogram in blue represents the correlation among all the genes present in our compendium, whereas the histogram in green is based upon the correlations of the 107 genes selected in the core set. Note there is a shift towards positive correlation values, pointing to a common regulatory influence over the selected genes. B) Number of genes identified in the DevR regulon compared to the number of targets identified through ChIP-seq experiments or the ones cited in literature [,–78]. C) Group assignment of the 622 targets identified by ChIP-seq for DevR. G0 contains genes for which non discernible expression pattern has been found. G1 correspond to the usually named DevR regulon, whereas G2-4 contains genes that show correlated expression patterns, although these patterns are not consistent with the previously described behaviour of DevR regulon. A detailed list of these genes is available in Additional file 12 and the output of the GO-enrichment analysis is shown in Additional file 16.
Figure 8
Figure 8
ZuR regulon. A) Bicluster formed by members of the ZuR as reported in literature [81]. The grey line represents the average expression levels of the members of ZuR regulon in the conditions in our compendium. The numbers identify the 23 conditions that have been included in the bicluster. The horizontal bar and the different regions indicated by numbers refer to the classification of the conditions as described in Materials and Methods. Notice the clear up-regulation of this set in conditions of type 9: Transcription inhibition, in particular these values correspond to experiments were Rifapentine was added to the medium. For clarity, expression values have been scaled, so that the mean value for each gene when all conditions are considered is zero. B) Identified ZuR binding motif. E-value 4.2*10−49. C) Number of genes in the ZuR regulon (Additional file 17) compared to the ones previously identified [81], the set anticorr. contains Rv0232 and lpqR, that show anticorrelation with the rest of the genes in the regulon.

References

    1. Veiga DFT, Dutta B, Balázsi G. Network inference and network response identification: moving genome-scale data to the next level of biological discovery. Mol Biosyst. 2010;6:469–480. - PMC - PubMed
    1. De Smet R, Marchal K. Advantages and limitations of current network inference methods. Nat Rev Micro. 2010;8:717–729. - PubMed
    1. Bansal M, Belcastro V, Ambesi-Impiombato A, di Bernardo D. How to infer gene networks from expression profiles. Mol Syst Biol. 2007;3:78. - PMC - PubMed
    1. Bonneau R, Reiss DJ, Shannon P, Facciotti M, Hood L, Baliga NS, Thorsson V. The Inferelator: an algorithm for learning parsimonious regulatory networks from systems-biology data sets de novo. Genome Biol. 2006;7:R36. - PMC - PubMed
    1. Cantone I, Marucci L, Iorio F, Ricci MA, Belcastro V, Bansal M, Santini S, di Bernardo M, di Bernardo D, Cosma MP. A yeast synthetic network for in vivo assessment of reverse-engineering and modeling approaches. Cell. 2009;137:172–181. - PubMed

MeSH terms

LinkOut - more resources