. 2014 Oct 3;9(10):e108950.
doi: 10.1371/journal.pone.0108950. eCollection 2014.

A miRNA signature for defining aggressive phenotype and prognosis in gliomas

Affiliations

A miRNA signature for defining aggressive phenotype and prognosis in gliomas

Raffaela Barbano et al. PLoS One. .

Abstract

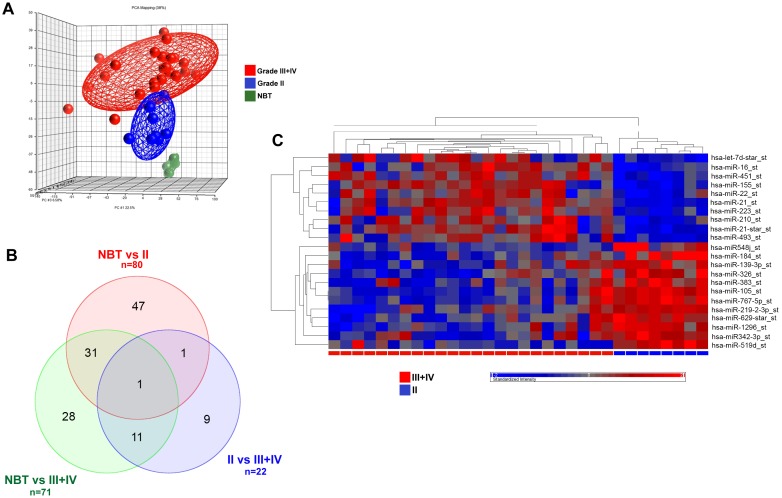
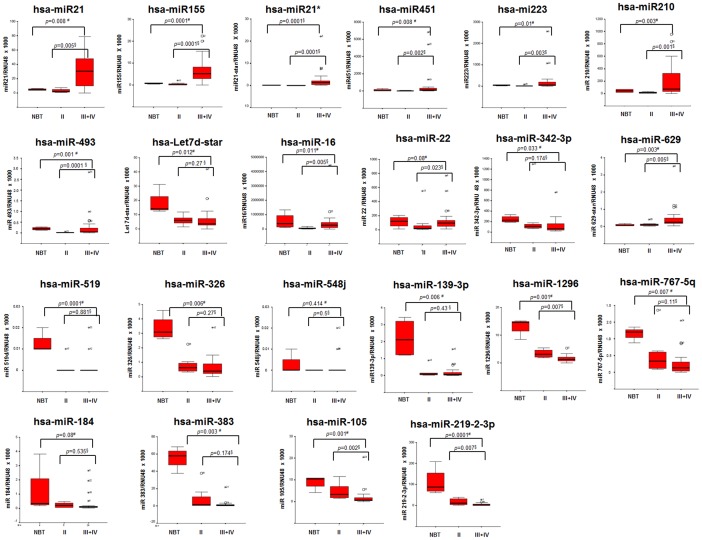
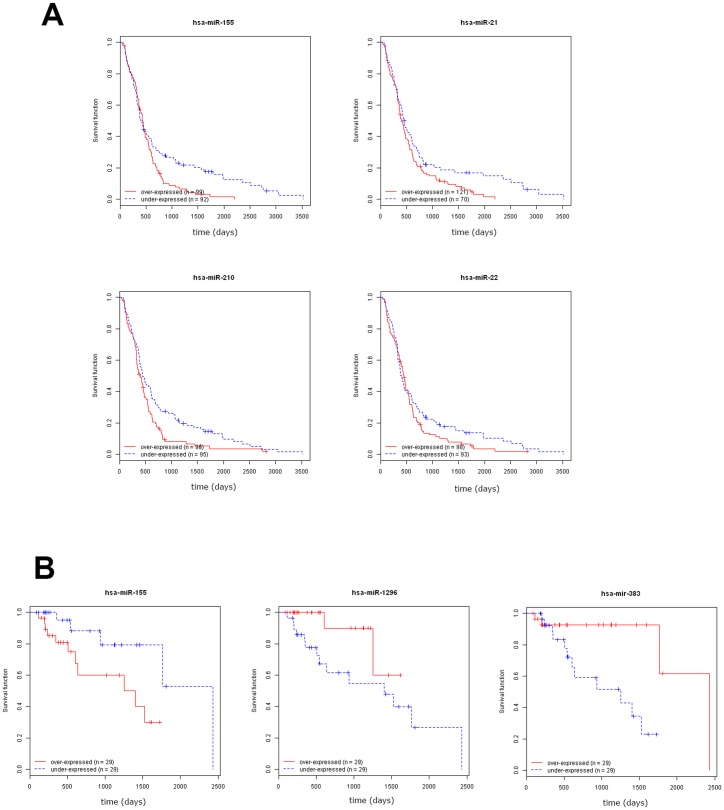
Gliomas represent a disparate group of tumours for which there are to date no cure. Thus, there is a recognized need for new diagnostic and therapeutic approaches based on increased understanding of their molecular nature. We performed the comparison of the microRNA (miRNA) profile of 8 WHO grade II gliomas and 24 higher grade tumours (2 WHO grade III and 22 glioblastomas) by using the Affymetrix GeneChip miRNA Array v. 1.0. A relative quantification method (RT-qPCR) with standard curve was used to confirm the 22 miRNA signature resulted by array analysis. The prognostic performances of the confirmed miRNAs were estimated on the Tumor Cancer Genome Atlas (TCGA) datasets. We identified 22 miRNAs distinguishing grade II gliomas from higher grade tumours. RT-qPCR confirmed the differential expression in the two patients' groups for 13 out of the 22 miRNAs. The analysis of the Glioblastoma Multiforme (GBM) and Lower Grade Glioma (LGG) datasets from TCGA demonstrated the association with prognosis for 6 of those miRNAs. Moreover, in the GBM dataset miR-21 and miR-210 were predictors of worse prognosis in both univariable and multivariable Cox regression analyses (HR 1.19, p = 0.04, and HR 1.18, p = 0.029 respectively). Our results support a direct contribution of miRNAs to glioma cancerogenesis and suggest that miR-21 and miR-210 may play a role in the aggressive clinical behaviour of glioblastomas.


Conflict of interest statement

Competing Interests: The authors have declared that no competing interests exist.

Figures

Figure 1
Figure 1. miRNA expression analysis of gliomas.
A) Global views of gene expression by using the Principal Component Analysis (PCA) between grade III+IV tumours (HGG, red), and grade II gliomas (LGG, blue) samples and normal brain tissues (NBT, green). The analysis was performed by Partek Genomic Suite software using default setting that includes a threshold to remove low background level intensities. PCA percent mapping on the top of the plot indicates the explained variability on the first coordinates. B) Venn diagrams summarizing the number of miRNAs found to be differentially expressed by comparing grade II gliomas and NBT (green), grade II and grade III+IV gliomas (blue), grade III+IV gliomas and NBT (red). Also, number for conjoint (and non-conjoint) differentially expressed miRNAs are indicated. C) Hierarchical clustering analysis of miRNA expression profile for 8 grade II (blue) and 24 grade III+IV gliomas (red). Columns represent tissue specimens and rows miRNAs.
Figure 2
Figure 2. Validation of microarray data by qRT PCR analysis.
The 32 glioma samples and 4 NBT were analyzed by RT-qPCR for the expression of the 22 miRNAs identified by microarray profiling. Boxplots of miRNAs expression in normal brain tissues (NBT), WHO grade II gliomas (II) and WHO grade III and IV gliomas (III+IV). Expression levels are expressed as: target miRNA/RNU48 multiplied by 1000. The boxes mark the interquartile range, (interval between the 25th and 75th percentile). The lines inside the boxes denote median values, the symbol * denote the outliers. #NBT vs II vs III+IV comparison by Kruskall Wallis Test; §II vs III+IV comparison by Mann Whitney test.
Figure 3
Figure 3. Relationship between miRNAs expression and survival in glioma patients.
A) Kaplan-Meier curves showing the relationship of miR-155, miR-21, miR-210 and miR-22 with Overall Survival in patients from the GBM dataset. B) Kaplan- Meier curves showing the relationship of miR-155, miR-1296, and miR-383 with Overall Survival in Grade III glioma patients from the LGG dataset.

References

    1. Louis DN, Ohgaki H, Wiestler OD, Cavenee WK, Burger PC, et al. (2007) The 2007 WHO classification of tumours of the central nervous system. Acta Neuropathol 114: 97–109. - PMC - PubMed
    1. Galasso M, Sandhu SK, Volinia S (2012) MicroRNA expression signatures in solid malignancies. Cancer J 18: 238–243. - PubMed
    1. Parrella P, la Torre A, Copetti M, Valori VM, Barbano R, et al. (2009) High specificity of quantitative methylation-specific PCR analysis for MGMT promoter hypermethylation detection in gliomas. J Biomed Biotechnol 2009: 531692 10.1155/2009/531692.Epub2009Jun1 - DOI - PMC - PubMed
    1. Parrella P, Barbano R, Pasculli B, Fontana A, Copetti M, et al. (2014) Evaluation of microRNA-10b prognostic significance in a prospective cohort of breast cancer patients. Mol Cancer 13: 142. - PMC - PubMed
    1. Kim TM, Huang W, Park R, Park PJ, Johnson MD (2011) A developmental taxonomy of glioblastoma defined and maintained by MicroRNAs. Cancer Res 71: 3387–3399. - PMC - PubMed

Publication types

MeSH terms