. 2014 Oct 3;9(10):e109921.
doi: 10.1371/journal.pone.0109921. eCollection 2014.

High expression of hTERT and stemness genes in BORIS/CTCFL positive cells isolated from embryonic cancer cells

Affiliations

High expression of hTERT and stemness genes in BORIS/CTCFL positive cells isolated from embryonic cancer cells

Loredana Alberti et al. PLoS One. .

Abstract

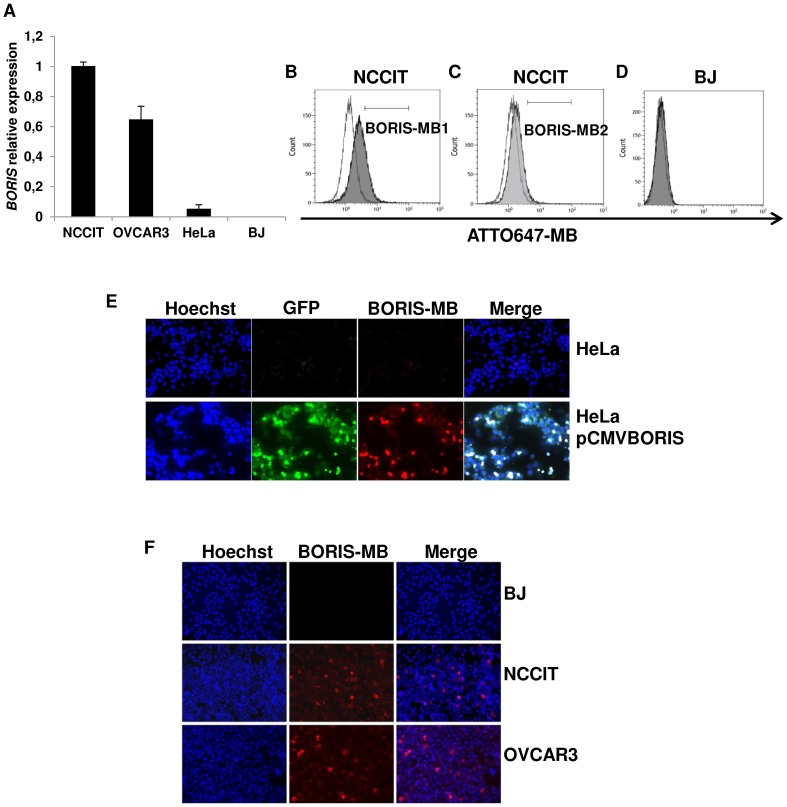
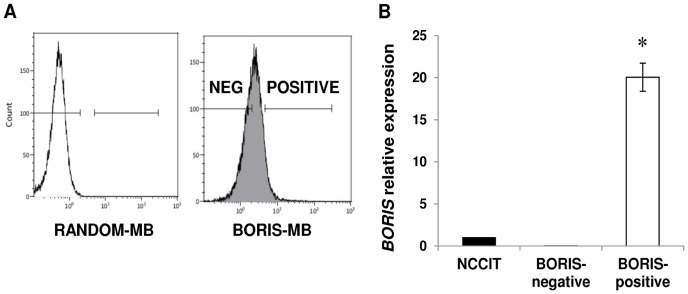
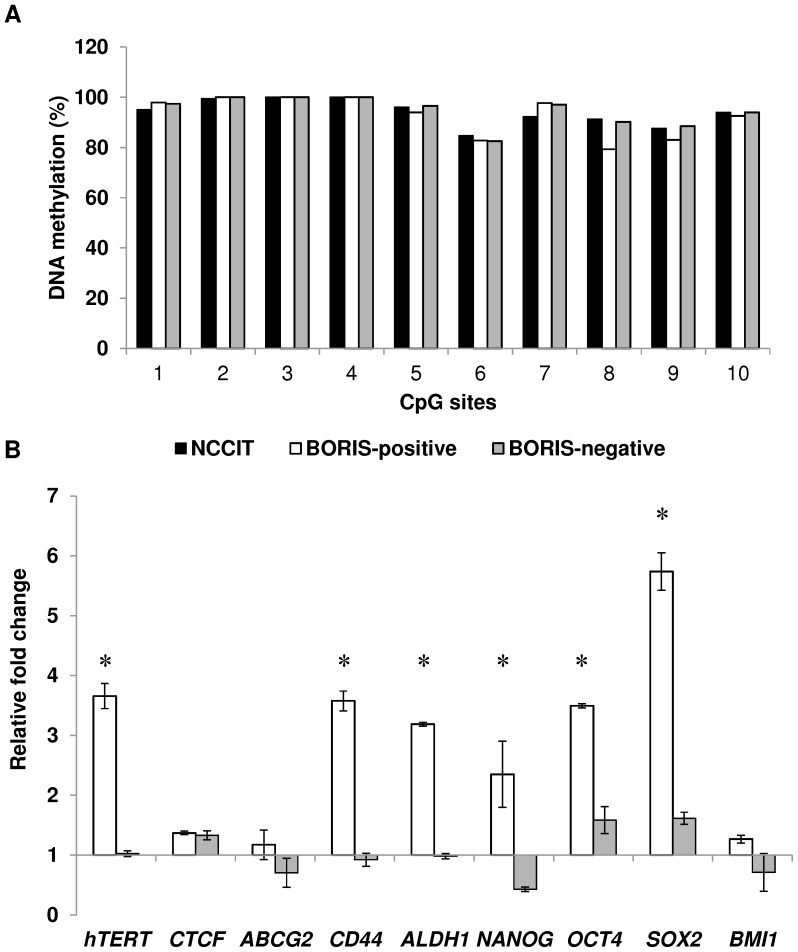
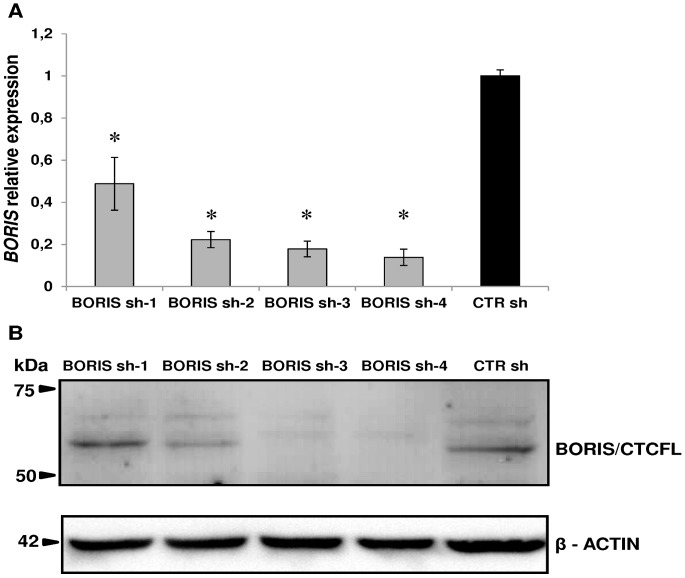
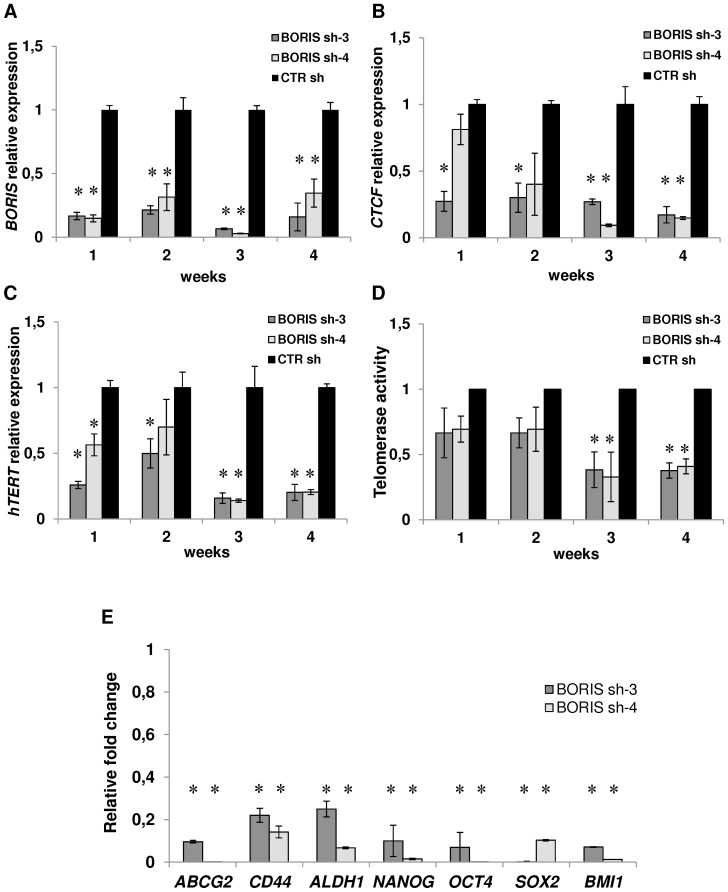
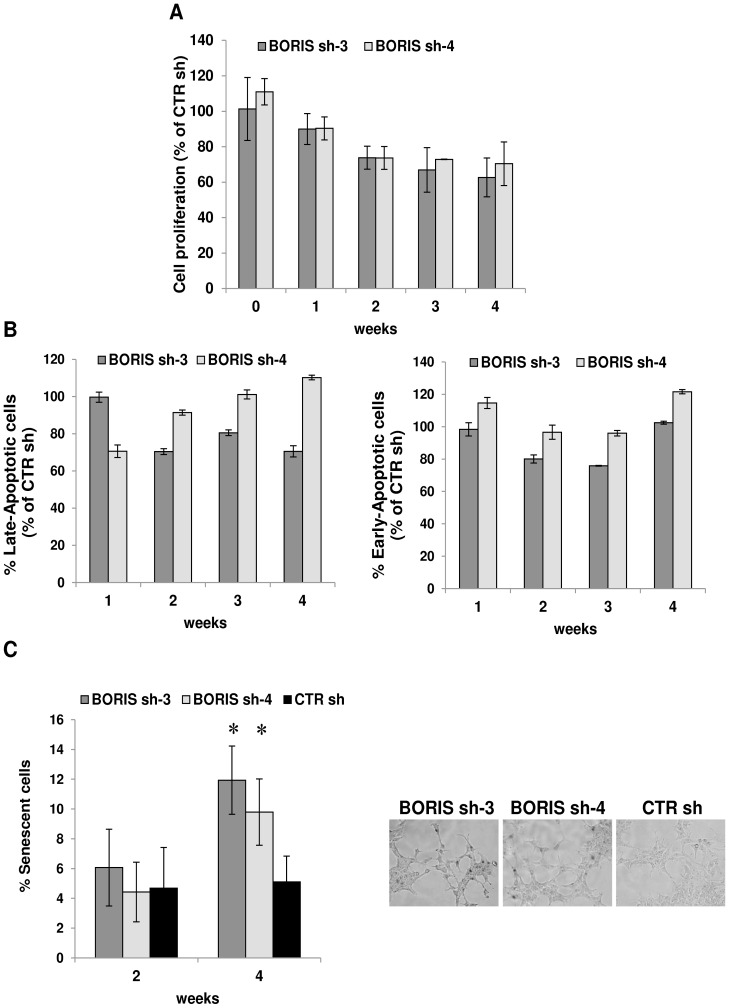
BORIS/CTCFL is a member of cancer testis antigen family normally expressed in germ cells. In tumors, it is aberrantly expressed although its functions are not completely well-defined. To better understand the functions of BORIS in cancer, we selected the embryonic cancer cells as a model. Using a molecular beacon, which specifically targets BORIS mRNA, we demonstrated that BORIS positive cells are a small subpopulation of tumor cells (3-5% of total). The BORIS-positive cells isolated using BORIS-molecular beacon, expressed higher telomerase hTERT, stem cell (NANOG, OCT4, SOX2) and cancer stem cell marker genes (CD44 and ALDH1) compared to the BORIS-negative tumor cells. In order to define the functional role of BORIS, stable BORIS-depleted embryonic cancer cells were generated. BORIS silencing strongly down-regulated the expression of hTERT, stem cell and cancer stem cell marker genes. Moreover, the BORIS knockdown increased cellular senescence in embryonic cancer cells, revealing a putative role of BORIS in the senescence biological program. Our data indicate an association of BORIS expressing cells subpopulation with the expression of stemness genes, highlighting the critical role played by BORIS in embryonic neoplastic disease.


Conflict of interest statement

Competing Interests: One of the authors (JB) is employed by a molecular pathology laboratory (Biopath Lab). This does not alter the authors' adherence to PLOS ONE policies on sharing data and materials.

Figures

Figure 1
Figure 1. Detection of BORIS mRNA using BORIS-MB.
(A) BORIS expression in human cell lines. Total RNA were isolated from human tumoral cell lines: NCCIT (embryonic), OVCAR3 (ovarian), HeLa (cervical) and normal BJ (fibroblast) cells. mRNA levels of BORIS were analyzed by qRT-PCR. Results were normalized to GAPDH and related to NCCIT cells. BJ and NCCIT were considered as negative and positive controls, respectively. Error bars represent the mean ± SD of 3 independent experiments. (B) Fluorescent signals measured by flow cytometry of NCCIT cells transfected with ATTO647-BORIS-MB1 (dark grey peak) and with ATTO647-RANDOM-MB (white peak). (C) Fluorescent signals measured by flow cytometry of NCCIT cells transfected with ATTO647-BORIS-MB2 (weak grey peak) and with ATTO647-RANDOM-MB (white peak). (D) Fluorescent signals measured by flow cytometry of BJ cells treated with ATTO647-BORIS-MB1 (from here onward referred to BORIS-MB, grey peak) and with ATTO647-RANDOM-MB (white peak). (E) BORIS expression in HeLa cells using BORIS-MB. Representative images of HeLa cells transiently transfected with the BORIS expression vector, pCMV-BORIS (bottom) and non-transfected control cells (top), 20× magnification. (F) BORIS expression in human cell lines as detected using BORIS-MB. Representative images of BJ, NCCIT and OVCAR3 cells, 20× magnification. For fluorescence imaging, 1×10⁶ cells were incubated at 37°C for 1 hour in serum-free DMEM medium with Cy3-BORIS-MB (200 nM). Hoechst 33342 5 µg/mL was added during the last 10 min of incubation. Slides were analyzed by fluorescence microscopy.
Figure 2
Figure 2. Isolation of BORIS-positive cells using BORIS-MB.
(A) NCCIT cells were transfected with ATTO647-RANDOM-MB (white peak) and ATTO647-BORIS-MB (grey peak). The two subpopulations, BORIS-negative and BORIS-positive cells were selected by comparing the fluorescent signal of RANDOM-MB to that of BORIS-MB. After exclusion of dead cells by PI staining, the two fractions were sorted. (B) BORIS expression of the isolated BORIS-negative and BORIS-positive fractions was analyzed by qRT-PCR. The results were normalized to GAPDH and related to non-sorted NCCIT cells. Error bars represent the mean ± SD of 3 independent experiments. Asterisk indicates statistically significant difference (p<0.05) between BORIS-positive and non-sorted cells.
Figure 3
Figure 3. BORIS promoter methylation and expression of hTERT, stem cell and CSC markers genes in BORIS-positive cells.
(A) Methylation analysis of 10 CpG islands within the BORIS promoter region (B promoter). The representative graphic shows the percentage of methylation of each CpG island for the isolated BORIS-positive (white), -negative (grey) and non-sorted (black) NCCIT cells. (B) Expression analysis of the isolated BORIS-positive (white) and BORIS-negative (grey) fractions. The indicated genes were analyzed by qRT-PCR. The results were normalized to GAPDH and related to non-sorted NCCIT cells. Graphic shown one representative experiment out of 3 independent experiments (the trend was similar in all independent experiments). Asterisks indicate statistically significant difference (p<0.05) between BORIS-positive and the non-sorted cells.
Figure 4
Figure 4. BORIS-knockdown using lentivirus with doxycycline inducible BORIS-specific shRNA.
Four different BORIS shRNA lentiviral vectors (BORIS sh-1, sh-2, sh-3 and sh-4) and the vector carrying a scrambled sequence (CTR sh) were tested. NCCIT were transduced with the indicated lentivirus and sorted for eGFP marker expression. Then, cells were cultured with doxycycline-containing medium and after 3 days were analyzed. (A) BORIS mRNA levels were determined by qRT-PCR analysis, normalized to GAPDH and compared to that of CTR sh. Error bars represent the mean ± SD of 3 independent experiments. Asterisks indicate statistically significant difference (p<0.05) between BORIS sh-1, sh-2, sh-3 or sh-4 and CTR sh cells. (B) Representative western blot analysis. BORIS and β-actin (as a loading control) protein levels were determined by western blot. For both analyses (qRT-PCR and western blot) the knockdown was especially noticed with the BORIS sh-3 and sh-4 compared to the CTR shRNA.
Figure 5
Figure 5. Knockdown of BORIS resulted in decreasing expression of hTERT, stem cell and CSC markers genes.
NCCIT cells were engineered to stably exhibit knocked-down BORIS mRNA. BORIS sh-3, sh-4 and CTR sh (control with scrambled sequence) lentivirus were used to infect NCCIT cells. Each transduced cells were cultured with doxycycline to induce BORIS shRNA expression. Doxycycline-containing medium was replaced every 3 days. Each week over 1 month, mRNA levels of (A) BORIS, (B) CTCF and (C) hTERT were analyzed by qRT-PCR. Results were normalized with GAPDH and related to that of control cells (CTR sh) at each week. Error bars represent the mean ± SD of 3 independent experiments. (D) Telomerase activity was measured at each week by real-time quantitative PCR using TRAPEZE RT Telomerase Detection Kit. Values of telomerase activity of BORIS sh-3, sh-4 NCCIT-derived cells are related to that of control cells at each week. Error bars represent the mean ± SD of 3 independent experiments. (E) BORIS sh-3, sh-4 and CTR sh NCCIT-derived cells were cultured with doxycycline and after 7 days RNA was analyzed by qRT-PCR. mRNA levels of the indicated genes are related to that of control cells (CTR sh) after normalization with GAPDH. Error bars represent the mean ± SD of 3 independent experiments. Asterisks indicate statistically significant difference (p<0.05) between BORIS sh-3 or BORIS sh-4 and CTR sh cells.
Figure 6
Figure 6. BORIS knockdown impairs cell senescence but not apoptosis.
(A) Cell proliferation over 1 moth of dox-induced BORIS shRNA cells were analyzed by MTT assay. Results of the two specific BORIS-shRNA (BORIS sh-3 and sh-4) NCCIT-derived cells are indicated as a percentage compared to the cell proliferation of control cells (scrambled shRNA, CTR sh). Error bars represent the mean ± SD of 3 independent experiments. (B) After dox-induction of the BORIS specific shRNA in NCCIT cells, apoptosis was tested at each week using Annexin V Apoptosis Detection Kit. Results show the percentage of apoptotic cells (late apoptotic AnnexinV+/7AAD+ and early apoptotic AnnexinV+/7AAD) of BORIS sh-3 and sh-4 cells compared to the control cells. Error bars represent the mean ± SD of 3 experiments. (C) The senescence-associated β-galactosidase (SA-β-gal) staining was performed using β-galactosidase staining kit. SA-β-gal was analyzed after 2 and 4 weeks of dox-induction of the BORIS specific shRNA in NCCIT cells. Results show the percentage of senescent cells of BORIS sh-3, BORIS sh4 and control cells. Error bars represent the mean ± SD of 3 experiments. Asterisks indicate statistically significant difference (p<0.05) between BORIS sh-3 or BORIS sh-4 and CTR sh cells. Representative images of NCCIT cells after 4 weeks of BORIS knockdown and stained with SA-β-gal were shown.

References

    1. Moon H, Filippova G, Loukinov D, Pugacheva E, Chen Q, et al. (2005) CTCF is conserved from Drosophila to humans and confers enhancer blocking of the Fab-8 insulator. EMBO Rep 6: 165–170. - PMC - PubMed
    1. Dunn KL, Davie JR (2003) The many roles of the transcriptional regulator CTCF. Biochem Cell Biol 81: 161–167. - PubMed
    1. Herold M, Bartkuhn M, Renkawitz R (2012) CTCF: insights into insulator function during development. Development 139: 1045–1057. - PubMed
    1. Loukinov DI, Pugacheva E, Vatolin S, Pack SD, Moon H, et al. (2002) BORIS, a novel male germ-line-specific protein associated with epigenetic reprogramming events, shares the same 11-zinc-finger domain with CTCF, the insulator protein involved in reading imprinting marks in the soma. Proc Natl Acad Sci USA 99: 6806–6811. - PMC - PubMed
    1. Klenova EM, Morse HC 3rd, Ohlsson R, Lobanenkov VV (2002) The novel BORIS + CTCF gene family is uniquely involved in the epigenetics of normal biology and cancer. Semin Cancer Biol 12: 399–414. - PubMed

Publication types

MeSH terms