Comparative Study
. 2014 Oct 2;95(4):383-93.
doi: 10.1016/j.ajhg.2014.09.007.

Effective genetic-risk prediction using mixed models

Affiliations
Comparative Study

Effective genetic-risk prediction using mixed models

David Golan et al. Am J Hum Genet. .

Abstract

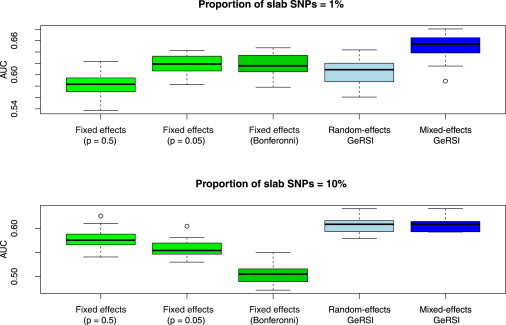
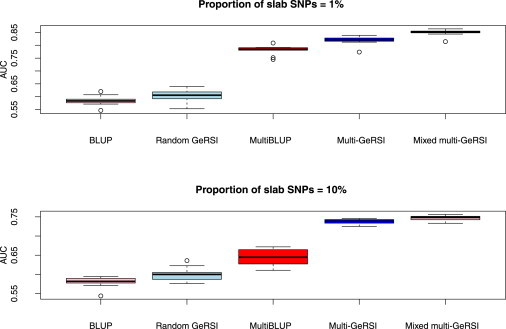
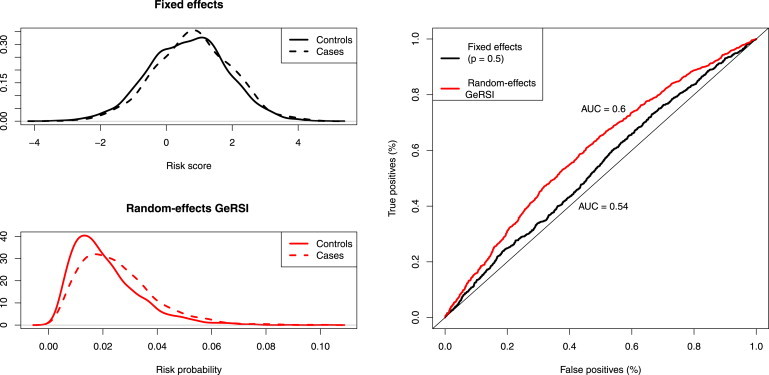
For predicting genetic risk, we propose a statistical approach that is specifically adapted to dealing with the challenges imposed by disease phenotypes and case-control sampling. Our approach (termed Genetic Risk Scores Inference [GeRSI]), combines the power of fixed-effects models (which estimate and aggregate the effects of single SNPs) and random-effects models (which rely primarily on whole-genome similarities between individuals) within the framework of the widely used liability-threshold model. We demonstrate in extensive simulation that GeRSI produces predictions that are consistently superior to current state-of-the-art approaches. When applying GeRSI to seven phenotypes from the Wellcome Trust Case Control Consortium (WTCCC) study, we confirm that the use of random effects is most beneficial for diseases that are known to be highly polygenic: hypertension (HT) and bipolar disorder (BD). For HT, there are no significant associations in the WTCCC data. The fixed-effects model yields an area under the ROC curve (AUC) of 54%, whereas GeRSI improves it to 59%. For BD, using GeRSI improves the AUC from 55% to 62%. For individuals ranked at the top 10% of BD risk predictions, using GeRSI substantially increases the BD relative risk from 1.4 to 2.5.


Figures

Figure 1
Figure 1
Comparison of the Performance of Fixed-, Random-, and Mixed-Effects Models in Predicting Disease Risk in a Spike-and-Slab Model We simulated balanced case-control studies of a disease with 5% prevalence and 50% heritability and for which the fraction of slab SNPs with large effects was either 1% or 10% out of a total of 50,000 simulated SNPs and for which these slab SNPs accounted for 90% of the heritability, in line with values from Chatterjee et al. We show the performance of the fixed-effects approach with (A) a Bonferroni-adjusted p value threshold, (B) a p value threshold of 0.05, and (C) a p value threshold of 0.5. In addition, we computed the correlation matrix G and used it to predict risk with the random-effects GeRSI approach, as well as with mixed-effects GeRSI treating the SNPs from (A) as fixed effects. In each simulation, we used a train set of 3,000 individuals and estimated the AUC for each method by using a test set of 1,000 individuals. We used the results from 20 independent simulations to draw the box plots.
Figure 2
Figure 2
Comparison of the Performance of BLUP and GeRSI Methods in Predicting Disease Risk in a Spike-and-Slab Model We compared the performance of BLUP, multiBLUP, GeRSI, multi-GeRSI, and mixed multi-GeRSI by using the same simulation setup as in Figure 1. We observed that GeRSI outperformed BLUP by utilizing the correct probabilistic setup. MultiBLUP takes into account the different effect-size distributions of spike and slab SNPs and therefore outperformed both. Multi-GeRSI enjoys the best of both worlds—correct sampling scheme and improved correlation structure—and so trumped all previous methods. Lastly, mixed multi-GeRSI improves over multi-GeRSI by including the most significant SNPs as fixed effects in addition to the other advantages of the multi-GeRSI approach.
Figure 3
Figure 3
Comparison of HT Risk Predictions with Fixed-Effects Models and Random-Effects GeRSI We used the fixed-effects approach with a p value threshold of 0.5. With fixed effects, there is very little difference between the distribution of risk scores of cases and control (top-left panel), but with random-effects GeRSI, out-of-sample risk predictions for cases is clearly skewed to the right (bottom-left panel). This is also evident in the comparison of the ROC curves of both methods (right panel).

References

    1. Goldstein D.B. Common genetic variation and human traits. N. Engl. J. Med. 2009;360:1696–1698. - PubMed
    1. Purcell S.M., Wray N.R., Stone J.L., Visscher P.M., O’Donovan M.C., Sullivan P.F., Sklar P., Ruderfer D.M., McQuillin A., Morris D.W., International Schizophrenia Consortium Common polygenic variation contributes to risk of schizophrenia and bipolar disorder. Nature. 2009;460:748–752. - PMC - PubMed
    1. Dudbridge F. Power and predictive accuracy of polygenic risk scores. PLoS Genet. 2013;9:e1003348. - PMC - PubMed
    1. Chatterjee N., Wheeler B., Sampson J., Hartge P., Chanock S.J., Park J.-H. Projecting the performance of risk prediction based on polygenic analyses of genome-wide association studies. Nat. Genet. 2013;45:400–405. e1–e3. - PMC - PubMed
    1. Abraham G., Tye-Din J.A., Bhalala O.G., Kowalczyk A., Zobel J., Inouye M. Accurate and robust genomic prediction of celiac disease using statistical learning. PLoS Genet. 2014;10:e1004137. - PMC - PubMed

Publication types

LinkOut - more resources