. 2015 Jan;77(1-1):75-83.
doi: 10.1038/pr.2014.144. Epub 2014 Oct 3.

Respiratory inductance plethysmography calibration for pediatric upper airway obstruction: an animal model

Affiliations

Respiratory inductance plethysmography calibration for pediatric upper airway obstruction: an animal model

Robinder G Khemani et al. Pediatr Res. 2015 Jan.

Abstract

Background: We sought to determine optimal methods of respiratory inductance plethysmography (RIP) flow calibration for application to pediatric postextubation upper airway obstruction.

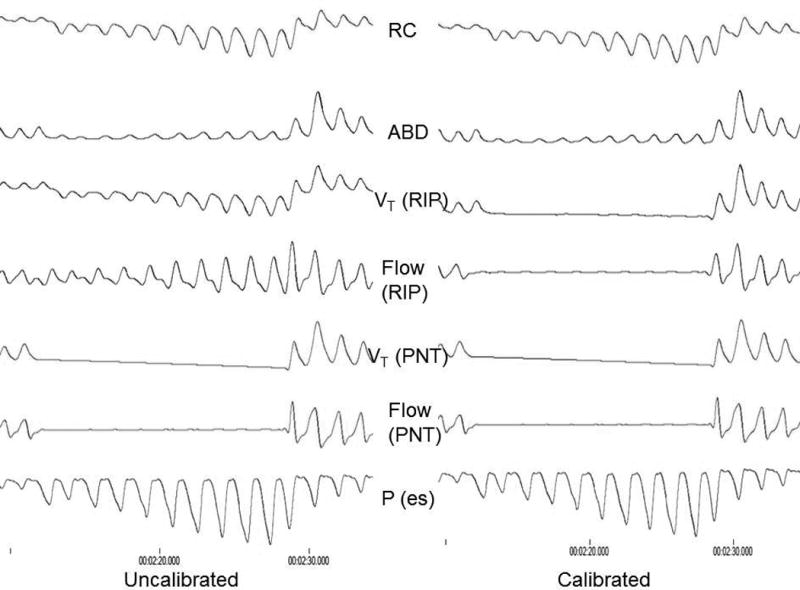
Methods: We measured RIP, spirometry, and esophageal manometry in spontaneously breathing, intubated Rhesus monkeys with increasing inspiratory resistance. RIP calibration was based on: ΔµV(ao) ≈ M[ΔµV(RC) + K(ΔµV(AB))] where K establishes the relationship between the uncalibrated rib cage (ΔµV(RC)) and abdominal (ΔµV(AB)) RIP signals. We calculated K during (i) isovolume maneuvers during a negative inspiratory force (NIF), (ii) quantitative diagnostic calibration (QDC) during (a) tidal breathing, (b) continuous positive airway pressure (CPAP), and (c) increasing degrees of upper airway obstruction (UAO). We compared the calibrated RIP flow waveform to spirometry quantitatively and qualitatively.

Results: Isovolume calibrated RIP flow tracings were more accurate (against spirometry) both quantitatively and qualitatively than those from QDC (P < 0.0001), with bigger differences as UAO worsened. Isovolume calibration yielded nearly identical clinical interpretation of inspiratory flow limitation as spirometry.

Conclusion: In an animal model of pediatric UAO, isovolume calibrated RIP flow tracings are accurate against spirometry. QDC during tidal breathing yields poor RIP flow calibration, particularly as UAO worsens. Routine use of a NIF maneuver before extubation affords the opportunity to use RIP to study postextubation UAO in children.


Conflict of interest statement

There are no conflicts of interest for any of the authors.

Figures

Figure 1
Figure 1. Box plot of inspiratory Mean Squared Error between RIP and Spirometry per resistor by Calibration procedure
RIP flow pattern compared to gold standard of spirometry using two different RIP calibration techniques (Isovolume maneuver with a NIF (Isocal) versus QDC calibration on CPAP of 5cmH2O (QDCCPAP)) with increasing degrees of UAO. Note the improved accuracy (lower MSE) for RIP calibration using isovolume conditions compared to QDC calibration on CPAP, particularly as UAO increases (all p<0.0001). Bar is median, box is Inter Quartile Range (IQR), whisker is non-outlier range. Circle and unfilled box is Isovolume, Square and grey box is QDC on CPAP of 5cmH2O.
Figure 2
Figure 2. Example of NIF to achieve isovolume maneuver (10 breaths)
The left panel represents the raw, uncalibrated signals. Notice isovolume conditions are achieved (RC and ABD opposite directions to each other, no flow on spirometry (PNT), and negative deflections in esophageal pressure (Pes)). The right panel represents the same maneuver after RIP calibration using the calibration factor determined from the NIF. Notice how the RIP flow and volume (Vt) tracings more closely represent the zero flow seen on spirometry after calibration.
Figure 3
Figure 3. The percentage of flow (compared to tidal breathing) which would be seen during the NIF maneuver, based on RIP calibration technique
Zero flow was confirmed with spirometry, so the closer the values are to zero, the more accurate the RIP flow calibration. There was no difference in the percent of RIP flow seen at the two lung volumes (FRC and IC) when applying calibration factors generated from the isovolume maneuver (Iso_FRC and Iso_IC) (p>0.2). There was also no difference in the percent of RIP flow seen at the two lung volumes (FRC and IC) when applying calibration factors generated from the QDC calibration on CPAP (QDC_FRC and QDC_IC) (p>0.2). However, isovolume calibration was superior to QDC, at both lung volumes (p<0.002). Bar is median, box is Inter Quartile Range (IQR), whisker is non-outlier range. Triangles are raw data.
Figure 4
Figure 4. Box Plot of Calibration Factors (K) by condition
K values generated during Isovolume conditions at FRC and End inspiration, as well as using QDC calibration under various degrees of CPAP (5,10,15 cmH2O), unobstructed breathing, and mild UAO (50 and 200 cmH2O/ml/sec). Inner box represents median value for 10 monkeys, outer Box Inter-Quartile Range (IQR), and bars Non-outlier range. K values from isovolume conditions are statistically significantly higher than those generated using QDC during CPAP, unobstructed breathing (baseline), or mild obstructed breaths (p<0.01). K values using QDC on all conditions of CPAP and unobstructed breathing are similar (p>0.22). K values generated on obstructed breaths of 200 cmH2O/ml/sec are significantly higher than those on CPAP (p<0.02), but not as high as those seen during an isovolume maneuver.
Figure 5
Figure 5. Adequacy of RIP calibration Isovolume versus QDC on different conditions
RIP calibration compared to gold standard of spirometry using different RIP calibration techniques (Isovolume maneuver with a NIF (IsoCal) versus QDC calibration on the represented value of CPAP, unobstructed breathing, or mild UAO. A. CPAP 15 cmH2O B. CPAP 10 cmH2O C. CPAP 5 cmH2O D. Tidal Breathing E. Inspiratory Resistance 50 cmH2O/ml/sec F. Inspiratory Resistance 200 cmH2O/ml/sec. Bar is median, outer box is interquartile range, and whisker is non-outlier range. Calibration using isovolume conditions resulted in a lower median mean square error than calibration using QDC for all conditions other than CPAP of 15cmH20 (p<0.0001). For CPAP of 15, QDC resulted in lower median mean square error than calibration using isovolume conditions (p<0.001).
Figure 6
Figure 6. Qualitative assessment of accuracy of calibrated RIP (right) against spirometry (left)
The top plots are flow versus pressure, examining flow limitation. The bottom tracings are flow versus time, using both techniques.

References

    1. Argent AC, Newth CJ, Klein M. The mechanics of breathing in children with acute severe croup. Intensive Care Med. 2008;34:324–32. - PubMed
    1. Newth CJ, Levison H, Bryan AC. The respiratory status of children with croup. J Pediatr. 1972;81:1068–73. - PubMed
    1. Khemani R, Schneider J, Morzov R, Markovitz B, Newth CJ. Pediatric Upper Airway Obstruction: Interobserver variability is the road to perdition. J Crit Care. 2013;28:490–7. - PMC - PubMed
    1. Argent AC, Hatherill M, Newth CJ, Klein M. The effect of epinephrine by nebulization on measures of airway obstruction in patients with acute severe croup. Intensive Care Med. 2008;34:138–47. 2008. - PubMed
    1. Kaplan V, Zhang JN, Russi EW, Bloch KE. Detection of inspiratory flow limitation during sleep by computer assisted respiratory inductive plethysmography. Eur Respir J. 2000;15:570–8. - PubMed

Publication types