. 2014 Oct 2;15(4):459-471.
doi: 10.1016/j.stem.2014.09.002.

Tet3 and DNA replication mediate demethylation of both the maternal and paternal genomes in mouse zygotes

Affiliations

Tet3 and DNA replication mediate demethylation of both the maternal and paternal genomes in mouse zygotes

Li Shen et al. Cell Stem Cell. .

Abstract

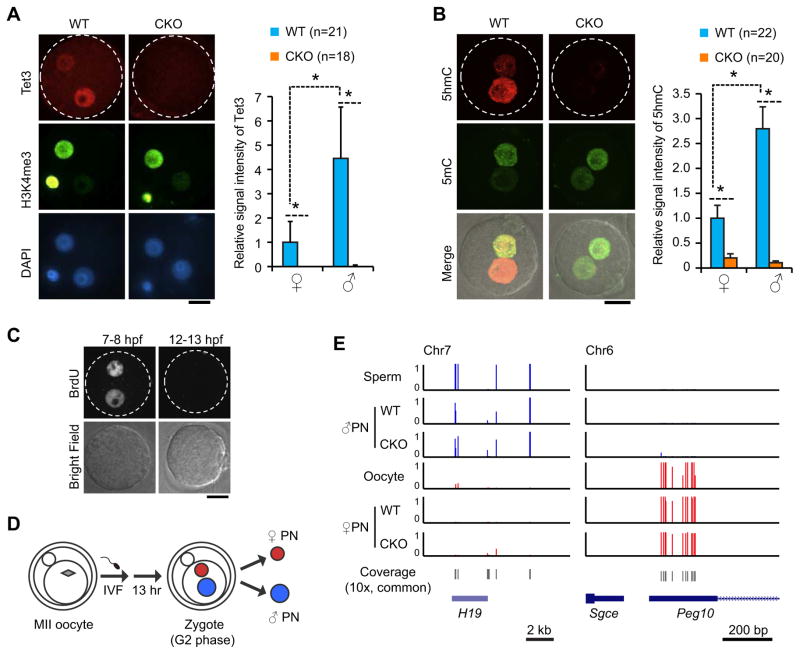
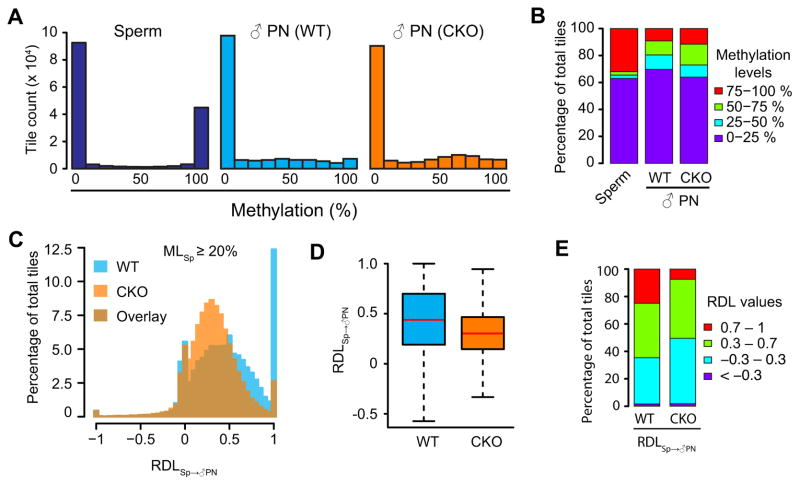
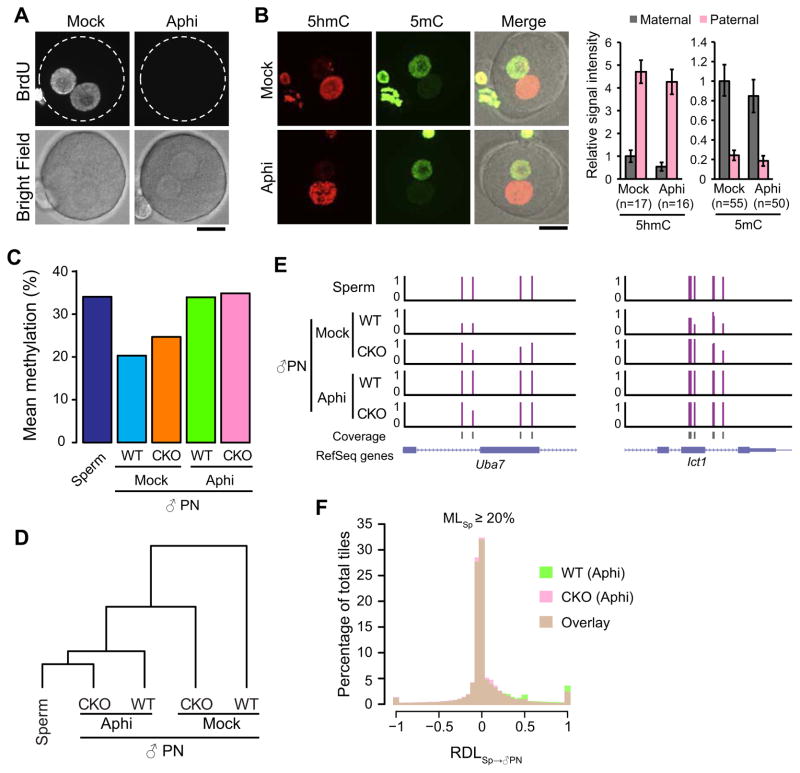
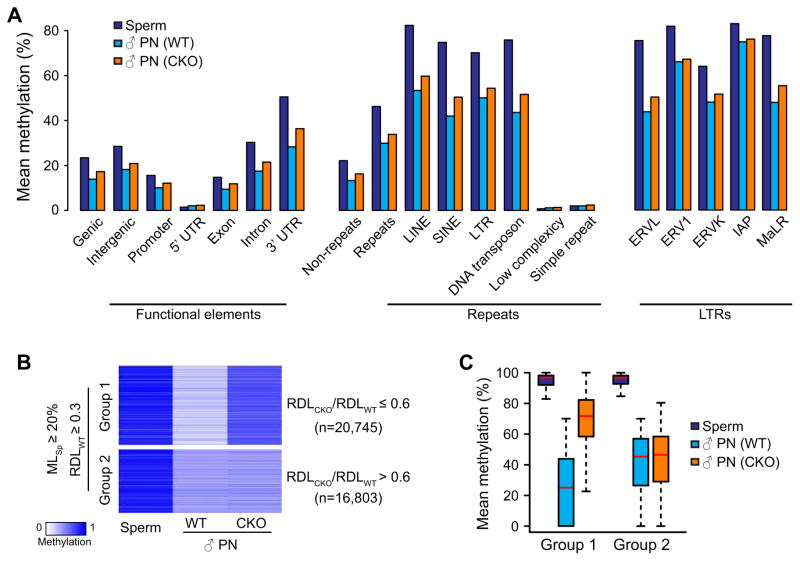
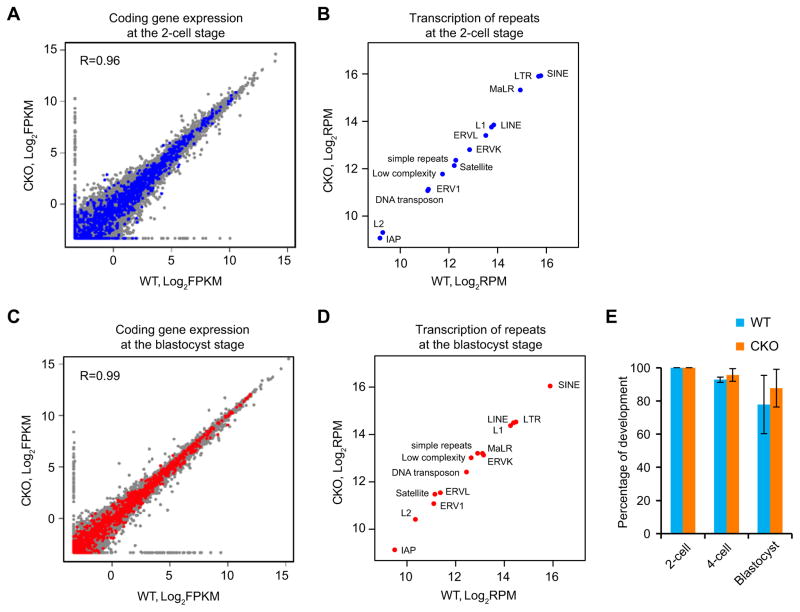
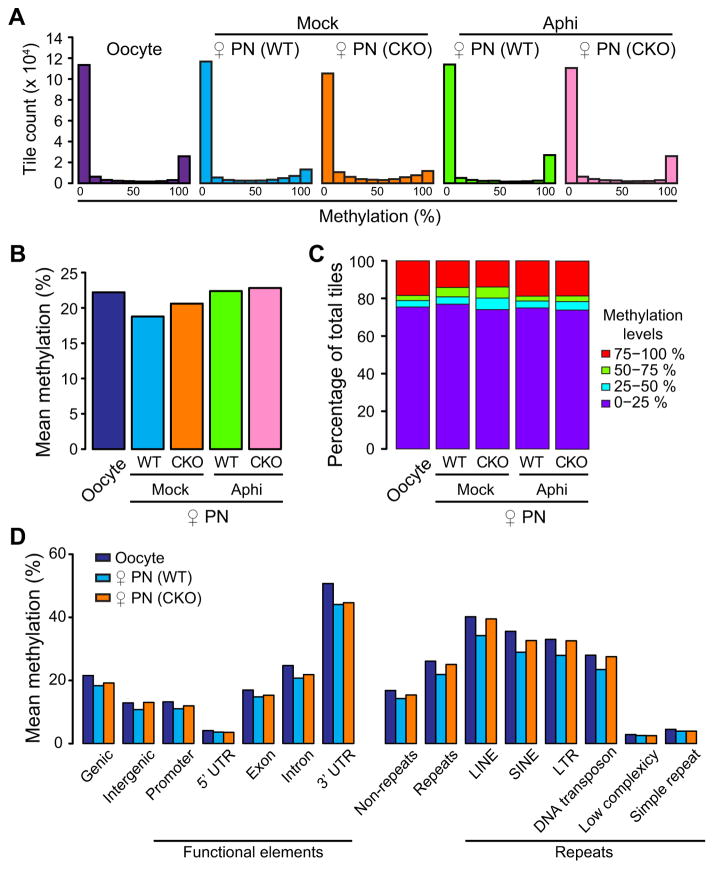
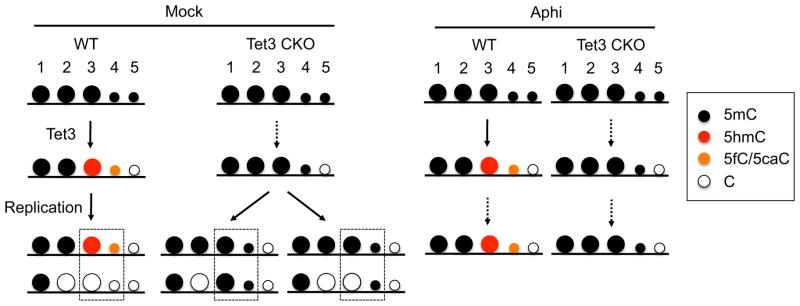
With the exception of imprinted genes and certain repeats, DNA methylation is globally erased during preimplantation development. Recent studies have suggested that Tet3-mediated oxidation of 5-methylcytosine (5mC) and DNA replication-dependent dilution both contribute to global paternal DNA demethylation, but demethylation of the maternal genome occurs via replication. Here we present genome-scale DNA methylation maps for both the paternal and maternal genomes of Tet3-depleted and/or DNA replication-inhibited zygotes. In both genomes, we found that inhibition of DNA replication blocks DNA demethylation independently from Tet3 function and that Tet3 facilitates DNA demethylation largely by coupling with DNA replication. For both genomes, our data indicate that replication-dependent dilution is the major contributor to demethylation, but Tet3 plays an important role, particularly at certain loci. Our study thus defines the respective functions of Tet3 and DNA replication in paternal DNA demethylation and reveals an unexpected contribution of Tet3 to demethylation of the maternal genome.


Figures

Figure 1
Figure 1. Generation and verification of Tet3-KO oocytes and isolation of paternal pronuclei from maternally Tet3-depleted zygotes
(A) Representative images and quantification verifying depletion of Tet3 protein from conditional Tet3 KO zygotes. Zygotes were stained with anti-Tet3 antibody (red). Maternal pronuclei are marked by immunostaining with an anti-H3K4me3 antibody (green). The relative Tet3 levels are quantified by setting the fluorescent signal of wild-type (WT) maternal pronucleus as 1. ♀, maternal pronucleus; ♂, paternal pronucleus; PB, polar body; CKO, Tet3 conditional knockout. Dotted circles indicate the rim of zygote cytoplasm. Scale bar, 20 μm. *, P<0.01 (student’s t-test). Error bars, s.d. (B) Representative images and quantification verifying loss of 5hmC in both paternal and maternal pronuclei of CKO zygotes. Zygotes were stained with anti-5hmC (red) and anti-5mC (green) antibodies at 13 hours after fertilization. The graph on the right represents the relative signal intensity of 5hmC with the maternal pronucleus of WT zygotes set as 1. (C) Representative images of zygotes stained with anti-BrdU antibody indicate that DNA replication is complete at 12 hrs post-fertilization. Zygotes were incubated in media containing BrdU during 7–8 or 12–13 hours after fertilization (hpf). (D) A schematic representation of pronuclear isolation at 13 hpf at G2 phase. PN, pronucleus. (E) Confirmation of the successful separation of the paternal and maternal pronuclei as indicated by imprinted genes exhibit expected allele-specific DNA methylation. Base-resolution methylation of paternal and maternal imprinting genes, H19 and Peg10, covered in our RRBS data set is shown. See also Figure S1.
Figure 2
Figure 2. Loss of Tet3 partially impairs paternal DNA demethylation
(A) Histograms of DNA methylation values across 100-bp tiles in sperm, WT and CKO paternal pronuclei. CpG sites that are at least 10x covered in all samples were examined. Note that common 10x CpG sites are more enriched in CpG-rich sequences and thus show lower overall DNA methylation level compared to that of all detected sites. (B) Distributions of DNA methylation levels in sperm, WT, and CKO paternal pronuclei. 100-bp tiles of genomic DNA were divided into four groups based on their methylation levels as low (0–25%, purple), medium-low (25–50%, blue), medium-high (50–75%, green), and high (75–100%, red) methylation. (C) Histograms showing the distributions of RDLSp→♂PN values of 100-bp tiles in WT and CKO paternal DNA. Only tiles that are methylated in sperm (MLSp ≥20%, n=58,101) were examined. RDLSp→♂PN is defined as [(MLSp – ML♂PN)/MLSp]. ML, DNA methylation level. RDL values less than −1 were set to −1. (D) Boxplot of RDLSp→♂PN values. Red line represents the median. Boxes and whiskers represent for the 25th and 75th, and 2.5th and 97.5th percentiles, respectively. (E) Distribution of RDLSp→♂PN values in WT and CKO paternal DNA. The RDL values are separated into four groups marked by red (0.7–1), green (0.3–0.7), blue (−0.3–0.3), and purple (<−0.3). See also Figure S2 and Table S1.
Figure 3
Figure 3. DNA replication is essential for paternal DNA demethylation
(A) Representative images of zygotes stained with anti-BrdU antibody. Zygotes were incubated in the media containing BrdU in the presence (Aphi) or absence (Mock) of aphidicolin during 7–8 hpf and fixed at 8 hpf. Dotted circles indicate the rim of zygote cytoplasm. Scale bar, 20 μm. (B) Representative images of control and aphidicolin-treated zygotes stained with anti-5hmC (red) and anti-5mC (green) antibodies. Scale bar, 20 μm. The graphs at right indicate relative signal intensity of 5hmC or 5mC. The value of the maternal pronucleus in WT zygotes was set as 1. The numbers of zygotes quantified are indicated below the bars. Error bars, s.d. (C) Mean DNA methylation levels of sperm and paternal DNA of both WT and CKO zygotes with or without aphidicolin treatment. (D) Cluster analysis of global DNA methylation landscape (CpGs with ≥ 10x coverage) of sperm and paternal pronuclear samples. DNA methylation pattern in paternal pronuclei of aphidicolin-treated CKO zygotes is most similar to that in sperm. (E) Representative genomic loci showing the distinctive roles of Tet3 and DNA replication in paternal DNA demethylation. (F) Histogram showing the distribution of RDLSp→♂PN values of 100-bp tiles in WT and CKO paternal DNA in the presence of aphidicolin. Only tiles that are methylated in sperm (MLSp≥20%, n=58,101) were examined. RDL values less than −1 were set to −1. See also Figure S3.
Figure 4
Figure 4. Tet3 knockout impairs DNA demethylation of both genic and repetitive sequences
(A) Mean DNA methylation levels of sperm and paternal pronuclear samples (both WT and CKO zygotes with or without aphidicolin treatment) in various genic and repetitive sequences, and in subcategories of LTR repeats. (B) Heatmap of 37,548 100-bp tiles that are methylated in sperm (MLSp≥20%) and demethylated after fertilization (RDLWT ≥ 0.3). These tiles can be divided into two groups. Tet3 KO affects demethylation of Group 1 tiles (RDLCKO/RDLWT≤0.6, n=20,745) but not Group 2 tiles (RDLCKO/RDLWT >0.6, n=16,803, including 1,082 tiles with RDLCKO/RDLWT >1.7). (C) Box plot of methylation levels in sperm, paternal pronuclei of both WT and CKO zygotes for Group 1 and Group 2 tiles defined in (B). See also Figure S4.
Figure 5
Figure 5. Tet3-mediated DNA demethylation does not affect zygotic gene activation and preimplantation development
(A) Scatter plot comparing RNA-Seq results of protein coding genes of WT and CKO 2-cell embryos. Genes containing the Group 1 tiles described in Figure 4B in their promoter or gene body are highlighted in blue. (B) Scatter plot comparing RNA-Seq results of various repetitive elements in WT and CKO 2-cell embryos. (C) Scatter plot comparing RNA-Seq results of protein coding genes of WT and CKO blastocysts. Genes containing the Group 1 tiles described in Figure 4B in their promoter or gene body are highlighted in red. (D) Scatter plot comparing RNA-Seq results of various repetitive elements in WT and CKO blastocysts. (E) Percentages of fertilized 1-cell embryos developed to the indicated stages. The experiments were repeated three times, with each experiment using more than18 embryos. A total of 121 and 63 of WT and CKO embryos, respectively, were examined. Error bars, s.d. See also Table S2.
Figure 6
Figure 6. Tet3 contributes to maternal DNA demethylation
(A) Histograms of methylation values across 100-bp tiles in oocytes, WT and CKO maternal pronuclei with or without aphidicolin treatment. CpG sites that are at least 10x covered in all samples are represented. (B) Mean DNA methylation levels of oocytes and maternal pronuclei of both WT and CKO zygotes with or without aphidicolin treatment. (C) Distribution of DNA methylation levels in oocytes, WT, and CKO maternal pronuclei. 100-bp tiles of genomic DNAs are divided into four groups based on their methylation levels as low (0–25%, purple), medium-low (25–50%, blue), medium-high (50–75%, green), and high (75–100%, red) methylation. (D) Mean DNA methylation levels of oocyte and maternal pronuclear samples (both WT and CKO zygotes with or without aphidicolin treatment) in various genetic elements.
Figure 7
Figure 7. Schematic model for paternal DNA demethylation
Detailed explanation is described in the discussion. Because the amounts of 5mCs taking the 4th or 5th paths are relatively small, these are indicated as smaller circles. Dotted arrows indicate blocked pathways. Dotted squires indicate Tet3-dependent demethylation loci as represented in the Group 1 of Figure 4B.

References

    1. Bian C, Yu X. PGC7 suppresses TET3 for protecting DNA methylation. Nucleic Acids Res 2013 - PMC - PubMed
    1. Goldberg AD, Allis CD, Bernstein E. Epigenetics: a landscape takes shape. Cell. 2007;128:635–638. - PubMed
    1. Gu TP, Guo F, Yang H, Wu HP, Xu GF, Liu W, Xie ZG, Shi L, He X, Jin SG, et al. The role of Tet3 DNA dioxygenase in epigenetic reprogramming by oocytes. Nature. 2011;477:606–610. - PubMed
    1. Guo H, Zhu P, Wu X, Li X, Wen L, Tang F. Single-cell methylome landscapes of mouse embryonic stem cells and early embryos analyzed using reduced representation bisulfite sequencing. Genome research. 2013;23:2126–2135. - PMC - PubMed
    1. Guo H, Zhu P, Yan L, Li R, Hu B, Lian Y, Yan J, Ren X, Lin S, Li J, et al. The DNA methylation landscape of human early embryos. Nature. 2014;511:606–610. - PubMed

Publication types

MeSH terms

Associated data