. 2014 Dec;79(5-6):193-203.
doi: 10.1007/s00239-014-9648-6. Epub 2014 Oct 4.

Mutation rates and evolution of multiple coding in RNA-based protocells

Affiliations

Mutation rates and evolution of multiple coding in RNA-based protocells

Folkert K de Boer et al. J Mol Evol. 2014 Dec.

Abstract

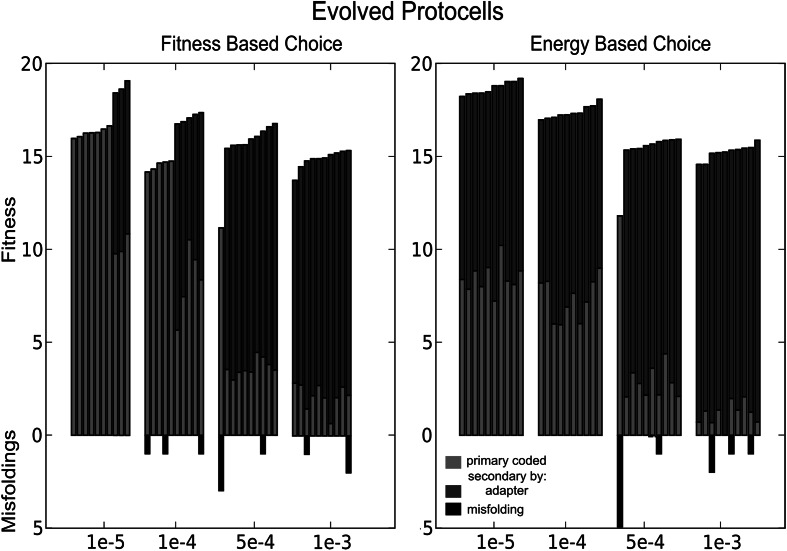
RNA has a myriad of biological roles in contemporary life. We use the RNA paradigm for genotype-phenotype mappings to study the evolution of multiple coding in dependence to mutation rates. We study three different one-to-many genotype-phenotype mappings which have the potential to encode the information for multiple functions on a single sequence. These three different maps are (i) cofolding, where two sequences can bind and "cofold," (ii) suboptimal folding, where the alternative foldings within a certain range of the native state of sequences are considered, and (iii) adapter-based folding, in which protocells can evolve adapter-mediated alternative foldings. We study how protocells with a set of sequences can code for a set of predefined functional structures, while avoiding all other structures, which are considered to be misfoldings. Note that such misfolded structures are far more prevalent than functional ones. Our results highlight the flexibility of the RNA sequence to secondary structure mapping and the power of evolution to shape the genotype-phenotype mapping. We show that high fitness can be achieved even at high mutation rates. Mutation rates affect genome size, but differently depending on which folding method is used. We observe that cofolding limits the possibility to avoid misfolded structures and that adapters are always beneficial for fitness, but even more beneficial at low mutation rates. In all cases, the evolution procedure selects for molecules that can form additional structures. Our results indicate that inherent properties of RNA molecules and their interactions allow the evolution of complexity even at high mutation rates.


Figures

Fig. 1
Fig. 1
An example for each of the different genotype-phenotype mappings with the phenotype produced by a genotype. Genotype refers to all the information kept in the protocell, i.e., the different RNA sequences. Phenotype refers to all the structures which can be produced with the folding-rules given by the genotype-phenotype map. Cofolding has 2 RNA sequences, which combine in this case into three different structures. The suboptimal folding example has one sequence which has four alternative structures. The adapter-based folding example has three adapters and one ‘normal’ sequence. Corresponding binding sites are colored, which result in three structures next to the native fold
Fig. 2
Fig. 2
All the used target structures. Exact fitness is based on matching these structures (after removing dangling ends). However, all secondary structures with the same course-grained structure are considered functional. In our earlier work, we compared this set with a random set, leading to similar results (de Boer and Hogeweg 2012). The number of targets is chosen to be slightly larger than the maximum that can be retained at the lowest mutation rate considered. This choice is not structure specific: different structures are chosen in different simulations
Fig. 3
Fig. 3
Fitness and derivative of fitness of ten simulations for the different genotype-phenotype mappings. For most simulations, the largest change in fitness takes place within the first 50,000 time-steps. After that, protocells are still evolving, but can be considered to be in evolutionary stable state
Fig. 4
Fig. 4
For the mutation rates µ = 1×10⁻⁵, 1 × 10−4, 5 × 10−4, 1 × 10−3, ten simulations for each genotype-phenotype mapping are ranked according to their acquired fitness. Primary coded functions are depicted as red; secondary coded structures using cofolding, suboptimal folding, or adapter-based folding are in green, yellow, and blue, respectively. Left shows fitness(positive axis) and misfoldings (black, negative axis) and right shows number of functions (positive axis) and genome size (cyan, negative axis). The cofolding regime has the highest numbers of misfoldings and all simulations are ranked in the lower end of the fitness spectrum. However, while fitness and genome size of cofolding seem independent of mutation rates, the number of misfoldings decreases under higher mutation rates with the number of sequences. Note that fitness and misfoldings are explicitly separated over reproduction and lethality, respectively. The simulation under µ = 5 × 10−4 with the lowest acquired fitness, corresponds to a protocell in the adapter system that does not evolve adapters (see also Fig. 3) (Color figure online)
Fig. 5
Fig. 5
The acquired fitness of twenty simulations with the adapter-based genotype-phenotype mapping is ranked, for the mutation rates µ = 1×10⁻⁵, 1 × 10−4, 5 × 10−4, 1 × 10−3. In one set of simulations, the choice between functional structures is based on energy (right panel), in the other set, this choice is based on fitness (left panel). Primary coded functions are depicted as red; secondary coded structures as blue. On the negative axis, the number of corresponding misfolded structures (black) is shown. For a given mutation rate, fitness is considerably higher when adapters are evolved (Color figure online)
Fig. 6
Fig. 6
The acquired fitness of five simulations with the possibility of all three mappings(1) and five simulations with adapter based, and suboptimal folding(2) are ranked for the mutation rates µ = 1×10⁻⁵, 1 × 10−4, 5× 10−4, 1 × 10−3. Primary coded functions are depicted as red; secondary coded structures using cofolding, suboptimal folding, or adapter-based folding are in green, yellow, and blue, respectively. On the bottom, the number of corresponding misfolded structures (black) is shown (Color figure online)
Fig. 7
Fig. 7
For each mutation rate, the average Minimal Folding Energy of all evolved structures within the target set is shown. In the adapter-based simulations, the average MFE of the binding between adapters is depicted in yellow. Note that this is the sequence-adapter interaction only; energies of the base-pairing in the stem of the adapter are not considered. Also note that some targets are more difficult, and therefore, have a smaller sample-size or are not present under certain mutation rates. Even without the adapters, average acquired MFE of adapter-based protocells is stronger. The distributions of energies (without adapter-energies, over all mutation rates) under the two folding regimes differed significantly (p = 0.01, Mann–Whitney U test). While the most significant difference (p = 0.005) is under the highest mutation rate µ = 1 × 10−3, under µ = 1 × 10−5 energies did not differ significantly (p = 0.44) (Color figure online)

References

    1. Ancel LW, Fontana W. Plasticity, evolvability, and modularity in RNA. J Exp Zool. 2000;288(3):242–283. doi: 10.1002/1097-010X(20001015)288:3<242::AID-JEZ5>3.0.CO;2-O. - DOI - PubMed
    1. Attolini CS-O, Stadler PF. Neutral networks of interacting RNA secondary structures. Adv Complex Syst. 2005;08(02n03):275–283. doi: 10.1142/S0219525905000427. - DOI
    1. Bernhart SH, Tafer H, Flamm C, Stadler PF, Hofacker IL. Partition function and base pairing probabilities of RNA heterodimers. Algorithms Mol Biol. 2006;1(1):3. doi: 10.1186/1748-7188-1-3. - DOI - PMC - PubMed
    1. Bompfünewerer A, Flamm C, Fried C, Fritzsch G, Hofacker I, Lehmann J, Missal K, Mosig A, Müller B, Prohaska SJ, Stadler B, Stadler P, Tanzer A, Washietl S, Witwer C. Evolutionary patterns of non-coding RNAs. Theory Biosci. 2005;123(4):301–369. doi: 10.1016/j.thbio.2005.01.002. - DOI - PubMed
    1. Cuypers T, Hogeweg P. Virtual genomes in flux: an interplay of neutrality and adaptability explains genome expansion and streamlining. Genome Biol Evol. 2012;4(3):212–229. doi: 10.1093/gbe/evr141. - DOI - PMC - PubMed

Publication types

LinkOut - more resources