. 2015 Feb 15;331(2):292-308.
doi: 10.1016/j.yexcr.2014.09.032. Epub 2014 Sep 30.

Intercellular adhesion molecule-1 expression by skeletal muscle cells augments myogenesis

Affiliations

Intercellular adhesion molecule-1 expression by skeletal muscle cells augments myogenesis

Qingnian Goh et al. Exp Cell Res. .

Abstract

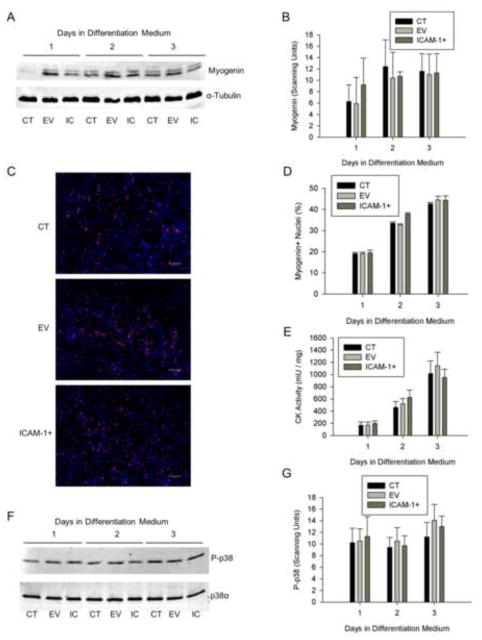
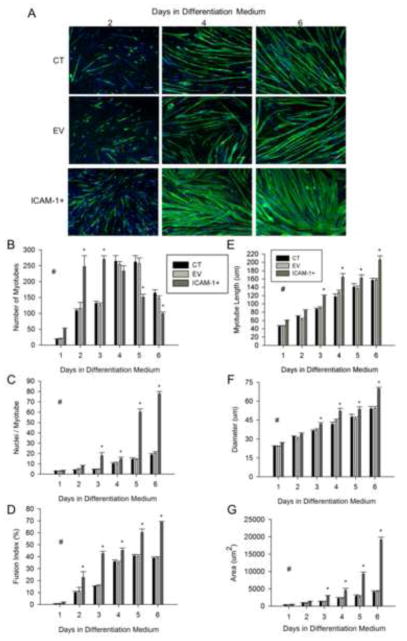
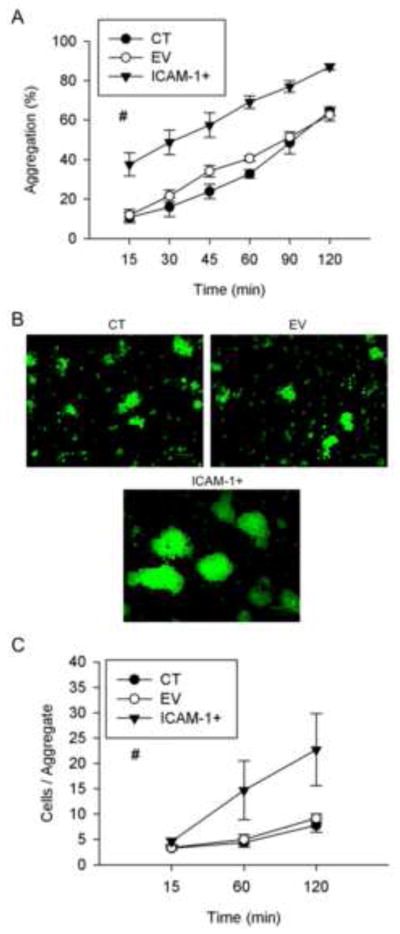
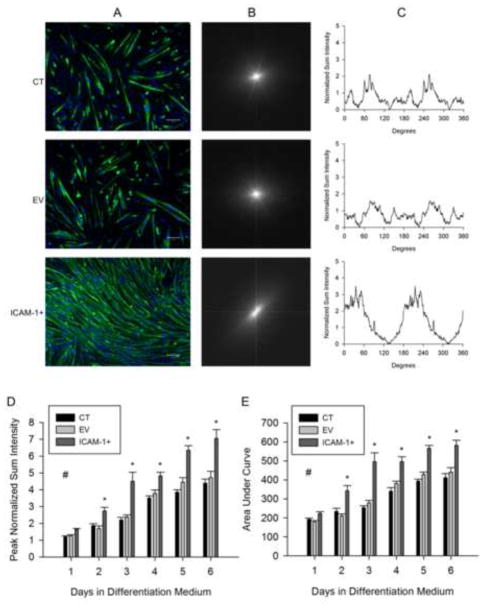
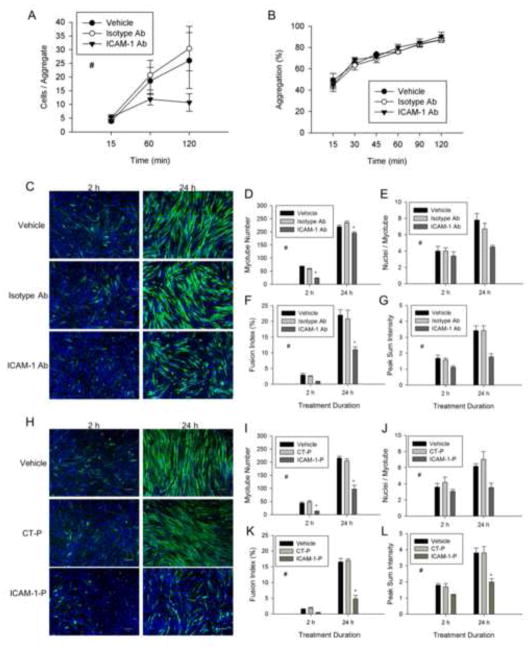
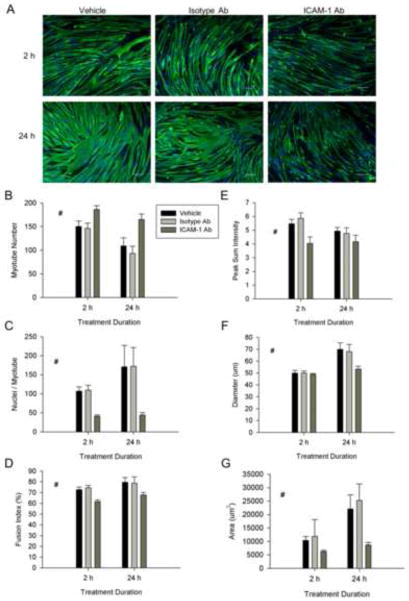
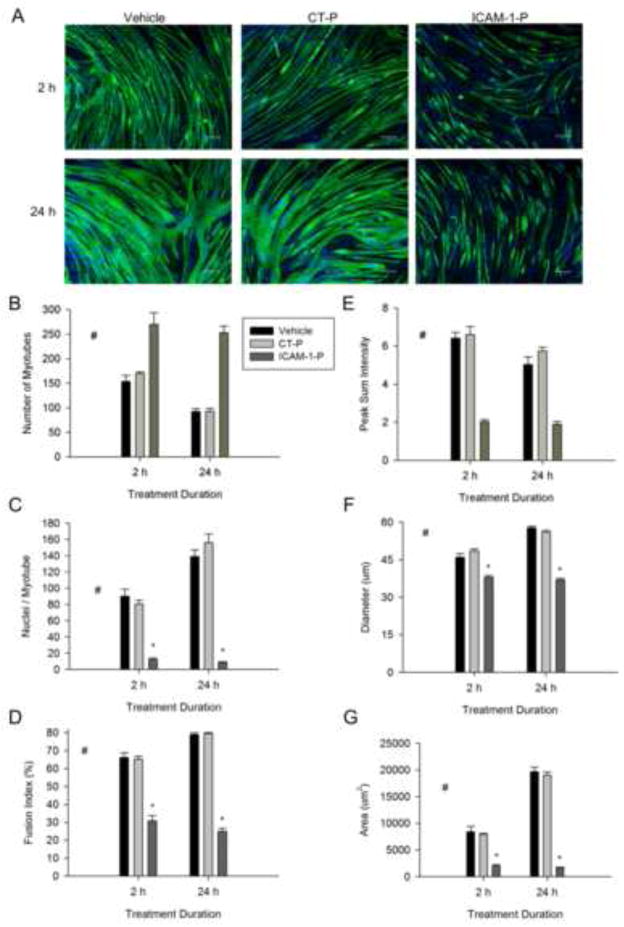
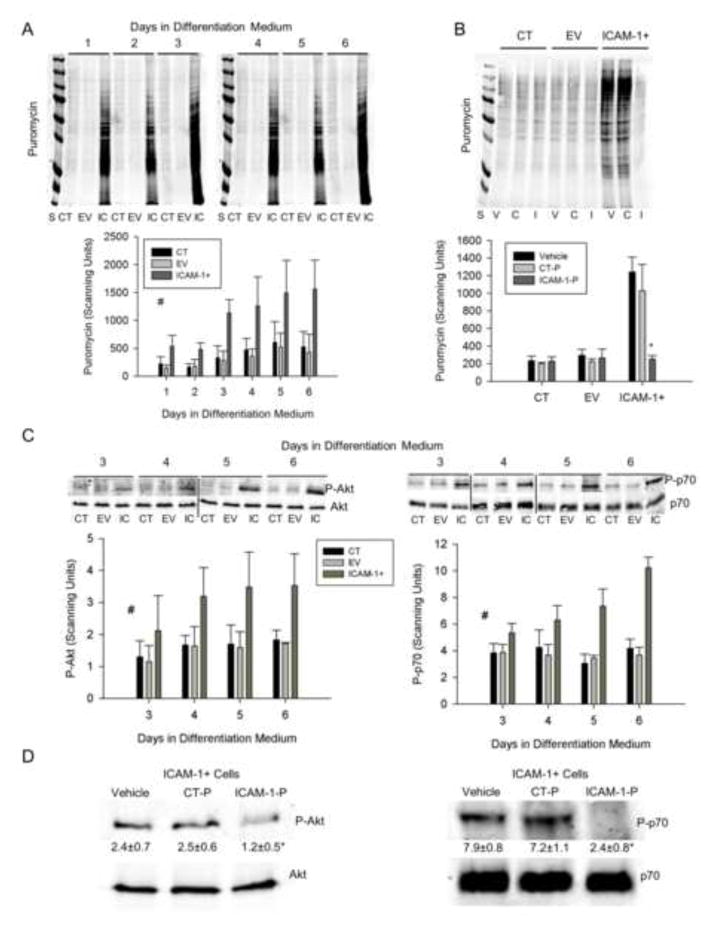
We previously demonstrated that the expression of intercellular adhesion molecule-1 (ICAM-1) by skeletal muscle cells after muscle overload contributes to ensuing regenerative and hypertrophic processes in skeletal muscle. The objective of the present study is to reveal mechanisms through which skeletal muscle cell expression of ICAM-1 augments regenerative and hypertrophic processes of myogenesis. This was accomplished by genetically engineering C2C12 myoblasts to stably express ICAM-1, and by inhibiting the adhesive and signaling functions of ICAM-1 through the use of a neutralizing antibody or cell penetrating peptide, respectively. Expression of ICAM-1 by cultured skeletal muscle cells augmented myoblast-myoblast adhesion, myotube formation, myonuclear number, myotube alignment, myotube-myotube fusion, and myotube size without influencing the ability of myoblasts to proliferate or differentiate. ICAM-1 augmented myotube formation, myonuclear accretion, and myotube alignment through a mechanism involving adhesion-induced activation of ICAM-1 signaling, as these dependent measures were reduced via antibody and peptide inhibition of ICAM-1. The adhesive and signaling functions of ICAM-1 also facilitated myotube hypertrophy through a mechanism involving myotube-myotube fusion, protein synthesis, and Akt/p70s6k signaling. Our findings demonstrate that ICAM-1 expression by skeletal muscle cells augments myogenesis, and establish a novel mechanism through which the inflammatory response facilitates growth processes in skeletal muscle.

Keywords: Adhesion molecules; Inflammation; Muscle hypertrophy; Muscle regeneration.


Conflict of interest statement

Competing Interests

The authors declare there are no competing financial or non-financial interests.

Figures

Figure 1
Figure 1
Myoblast differentiation. A) Representative western blot of myogenin (25 kDa) and α-tubulin (50 kDa; loading control) in control (CT), empty vector (EV), and ICAM-1+ (IC) cells through 3 d of differentiation. B) Quantitative analysis of western blot detection of myogenin (n=4). C) Representative images of myogenin (red) localization in nuclei (blue) of CT, EV, and ICAM-1+ cells at 2 d of differentiation (scale bar = 100 μm). D) Quantitative analysis of myogenin localization, expressed as the percentage of nuclei expressing myogenin, through 3 d of differentiation (n=4). E) Quantitative analysis of creatine kinase activity through 3 d of differentiation (n=4). F) Representative western blot of phosphorylated (Thr180/Tyr182) p38 MAPK (P-p38) and total p38α (40 kDa) in CT, EV, and IC cells after 1–3 d of differentiation. G) Quantitative analysis of phosphorylated p38 MAPK levels through 3 d of differentiation (n=4).
Figure 2
Figure 2
Myotube formation, myonuclear number, and myotube size. A) Representative images of myosin heavy chain (green) and nuclei (blue) in control (CT), empty vector (EV), and ICAM-1+ cells at 2, 4, and 6 d of differentiation (scale bar = 100 μm). Quantitative analysis of myotube number (B), average number of nuclei within myotubes (C), fusion index (D), as well as myotube length (E), diameter (F), and area (G) through 6 d of differentiation (n=6). # = higher for ICAM-1+ compared to CT and EV cells throughout 6 d of differentiation (main effect for cell line; p < 0.05). * = different for ICAM-1+ compared to CT and EV cells at indicated day of differentiation (interaction effect; p < 0.001).
Figure 3
Figure 3
Myoblast-myoblast adhesion. A) Percent aggregation of control (CT), empty vector (EV), and ICAM-1+ cells at selected intervals throughout 120 min of incubation (n=4–6). # = higher for ICAM-1+ compared to CT and EV cells (main effect for cell line; p < 0.001). B) Representative images of cytospin prepared slides of CT, EV, ICAM-1+ cells at 120 min of incubation (scale bar = 100 μm). Glutaraldehyde-induced fluorescence (green) was used to count the number of cells in individual aggregates. C) Average number of cells within aggregates of CT, EV, and ICAM-1+ cells at 15, 60, and 120 min of incubation (n=4–6). # = higher for ICAM-1+ compared to CT and EV cells (main effect for cell line; p < 0.001).
Figure 4
Figure 4
Myotube alignment. A) Representative images of myosin heavy chain (green) and nuclei (blue) in control (CT), empty vector (EV), and ICAM-1+ cells at 3 d of differentiation (scale bar = 100 um). B) Representative fast Fourier transform (FFT) images of corresponding images of myosin heavy chain and nuclei. C) Corresponding FFT alignment plots showing normalized sum intensity on the y-axis and degrees (0–360) on the x-axis. Quantitative analysis of peak normalized sum intensity (D) and area under the curve (E) of the FFT alignment plots (n=6). # = higher for ICAM-1+ compared to CT and EV cells throughout 6 d of differentiation (main effect for cell line; p < 0.001). * = higher for ICAM-1+ compared to CT and EV cells at indicated day of differentiation (interaction effect; p < 0.001).
Figure 5
Figure 5
The extracellular and cytoplasmic domains of ICAM-1 in the regulation of myotube formation, myonuclear accretion, and myotube alignment. ICAM-1+ cells were treated with vehicle, isotype control antibody (Isotype Ab; 100 μg/ml), control peptide (CT-P; 100 μg/ml), ICAM-1 antibody (ICAM-1 Ab; 100 μg/ml), or ICAM-1 peptide (ICAM-1-P; 100 μg/ml) at 1 d of differentiation for 2 or 24 h. A) Average number of cells within aggregates of ICAM-1+ cells treated with vehicle, Isotype Ab, or ICAM-1 Ab throughout 120 min of incubation (n=5). # = lower for ICAM-1 Ab compare to vehicle and Isotype-Ab (main effect for treatment; p < 0.05). B) Percent aggregation of ICAM-1+ cells treated with vehicle or antibody throughout 120 min of incubation (n=4). C) Representative images of myosin heavy chain (green) and nuclei (blue) in ICAM-1+ cells after 2 and 24 h treatment with vehicle or antibody (scale bar = 100 μm). Quantitative analysis of myotube number (D), average number of nuclei within myotubes (E), fusion index (F), and peak normalized sum intensity (G) (n=3). # = lower for ICAM-1 Ab compared to Isotype-Ab and vehicle (main effect for treatment; p < 0.05), * = lower for ICAM-1 Ab compared to Isotype-Ab and vehicle at indicated duration of treatment (interaction effect; p < 0.05). H) Representative images of myosin heavy chain (green) and nuclei (blue) in ICAM-1+ cells after 2 and 24 h treatment with vehicle or peptide (scale bar = 100 μm). Quantitative analysis of myotube number (I), average number of nuclei within myotubes (J), fusion index (K), and peak normalized sum intensity (L) (n=4). # = lower for ICAM-1-P compared to CT-P and vehicle (main effect for treatment; p < 0.005), * = lower for ICAM-1-P compared to CT-P and vehicle at indicated duration of treatment (interaction effect; p < 0.05).
Figure 6
Figure 6
The extracellular domain of ICAM-1 in the regulation of myotube fusion, alignment and size. ICAM-1+ cells were treated with vehicle, isotype control antibody (Isotype Ab;100 μg/ml), or ICAM-1 antibody (ICAM-1 Ab;100 μg/ml) at 5 d of differentiation for 2 or 24 h. A) Representative images of myosin heavy chain (green) and nuclei (blue) in ICAM-1+ cells after 2 and 24 h treatment with vehicle or antibody (scale bar = 100 μm). Quantitative analysis of myotube number (B), average number of nuclei within myotubes (C), and fusion index (D), as well as myotube alignment (E), diameter (F), and area (G) (n=4). # = different for ICAM-1 Ab compared to Isotype-Ab and vehicle (main effect for treatment; p < 0.05).
Figure 7
Figure 7
The cytoplasmic domain of ICAM-1 in the regulation of myotube fusion, alignment and size. ICAM-1+ cells were treated with vehicle, control peptide (CT-P; 50 μg/ml) or ICAM-1 peptide (ICAM-1-P; 50 μg/ml) at 5 d of differentiation and myotube indices were quantified 2 and 24 h after treatment. A) Representative images of myosin heavy chain (green) and nuclei (blue) in ICAM-1+ cells after 2 and 24 h of treatment with vehicle, CT-P, and ICAM-1-P (scale bar = 100 μm). Quantitative analysis of myotube number (B), average number of nuclei within myotubes (C), and fusion index (D), as well as myotube alignment (E), diameter (F), and area (G) (n=4). # = different for ICAM-1-P compared to CT-P and vehicle (main effect for treatment; p < 0.001), * = lower for ICAM-1-P compared to CT-P and vehicle at indicated duration of treatment (interaction effect; p < 0.001).
Figure 8
Figure 8
Protein synthesis and Akt/p70s6k signaling. A) Representative western blot and quantitative analysis (n=4) of puromycin incorporation into nascent proteins of cells treated with differentiation medium for up to 6 d (25 μg/lane). S = standards (250-15 kDa), CT = control, EV = empty vector, IC = ICAM-1+. # = higher for ICAM-1+ compared to CT and EV cells throughout 6 d of differentiation (main effect for cell line; p < 0.001). B) Representative western blot and quantitative analysis (n=4) of puromycin in CT, EV and ICAM-1+ cells treated with vehicle (V), control peptide (C or CT-P; 50 μg/ml), or ICAM-1 peptide (I or ICAM-1-P; 50 μg/ml) at 5 d of differentiation for 2 h prior to collection of cell lysates. * = ICAM-1 peptide reduced protein synthesis in ICAM-1+ cells to levels that were observed in CT and EV cells (interaction effect; p < 0.001). C) Representative western blots of Akt and p70s6k, as well as quantitative analysis of phosphorylated Akt (Ser473; P-Akt) and p70s6k (Thr389; P-p70) at 3–6 d of differentiation. # = higher for ICAM-1+ compared to CT and EV cells (main effect for cell line; p < 0.005). D) Representative western blots of Akt and p70s6k, as well as quantitative analysis of phosphorylated levels Akt and p70s6k for ICAM-1+ cells treated with vehicle, control peptide (CT-P; 50 μg/ml) or ICAM-1 peptide (ICAM-1-P; 50 μg/ml) at 5 d of differentiation for 2 h prior to collection of cell lysates. Scanning units are presented below blots for P-Akt and P-p70. * = lower for ICAM-1-P compared to vehicle and CT-P (p < 0.05).

Similar articles

Cited by

References

    1. Yin H, Price F, Rudnicki MA. Satellite cells and the muscle stem cell niche. Physiological reviews. 2013;93:23–67. - PMC - PubMed
    1. Pavlath GK. Current Progress Towards Understanding Mechanisms of Myoblast Fusion in Mammals. Springer-Verlag; Berlin, Heidelberger Platz 3, D–14197 Berlin, Germany: 2011.
    1. Krauss RS. Regulation of promyogenic signal transduction by cell-cell contact and adhesion. Experimental cell research. 2010;316:3042–3049. - PMC - PubMed
    1. Hindi SM, Tajrishi MM, Kumar A. Signaling mechanisms in Mammalian myoblast fusion. Science signaling. 2013;6:re2. - PMC - PubMed
    1. Abmayr SM, Pavlath GK. Myoblast fusion: lessons from flies and mice. Development. 2012;139:641–656. - PMC - PubMed

Publication types

MeSH terms

Substances