Comparative Study
. 2015 Sep;79(5):882-98.
doi: 10.1007/s00426-014-0608-y. Epub 2014 Oct 4.

Empirical validation of the diffusion model for recognition memory and a comparison of parameter-estimation methods

Affiliations
Comparative Study

Empirical validation of the diffusion model for recognition memory and a comparison of parameter-estimation methods

Nina R Arnold et al. Psychol Res. 2015 Sep.

Abstract

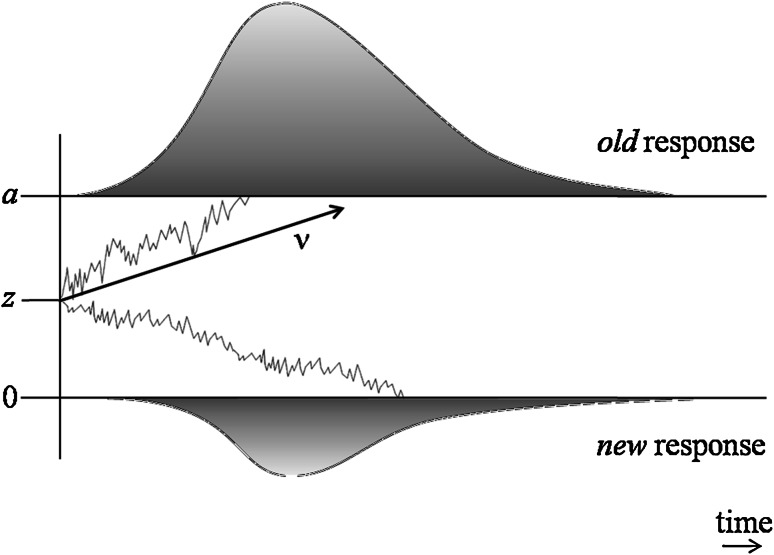
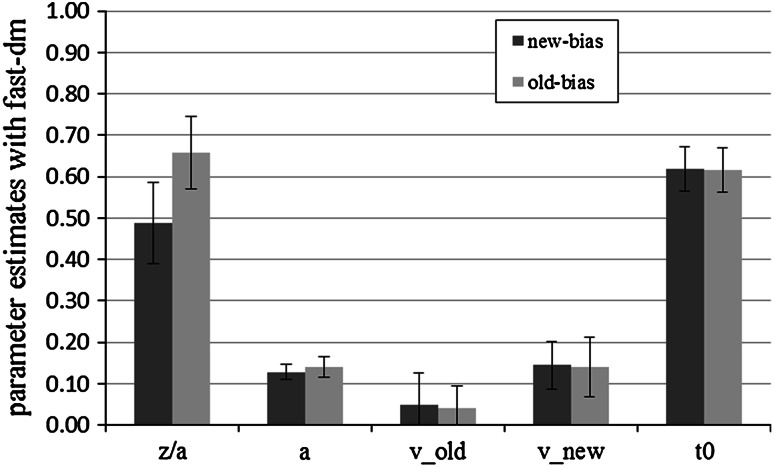
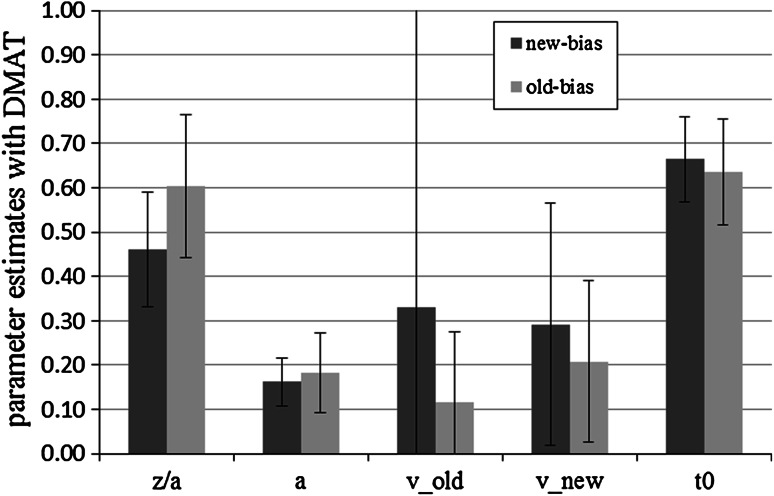
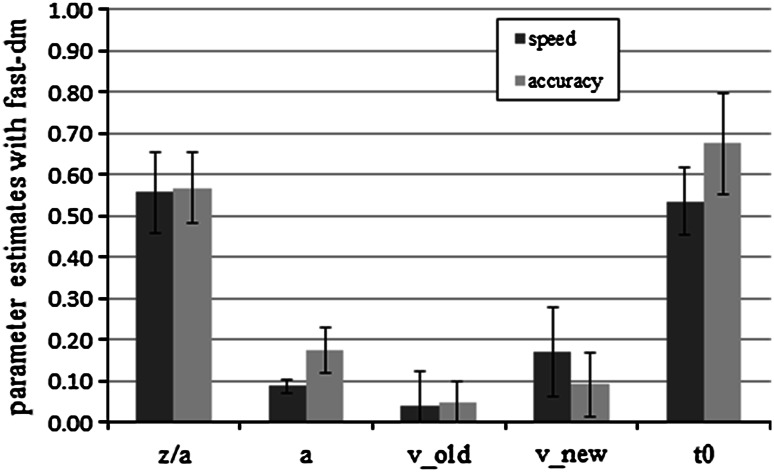
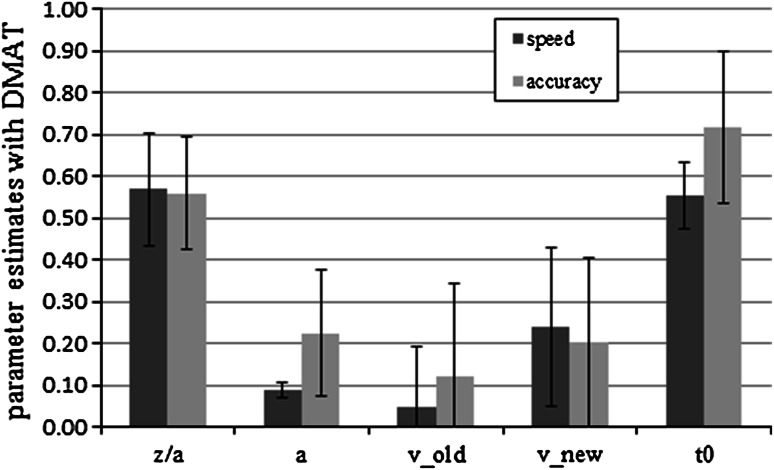
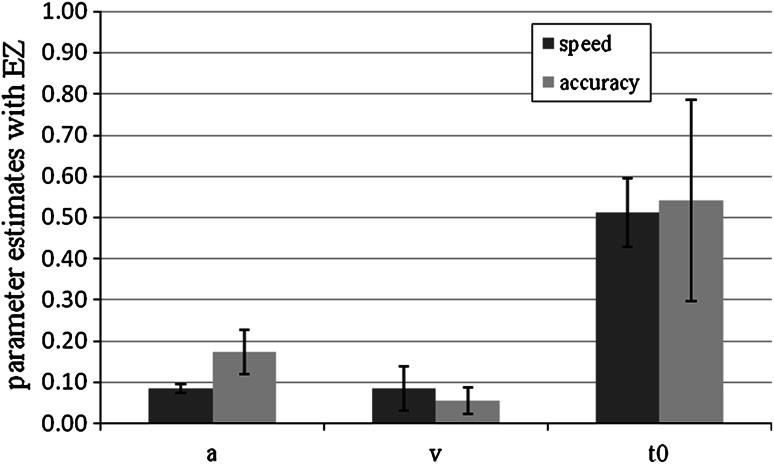
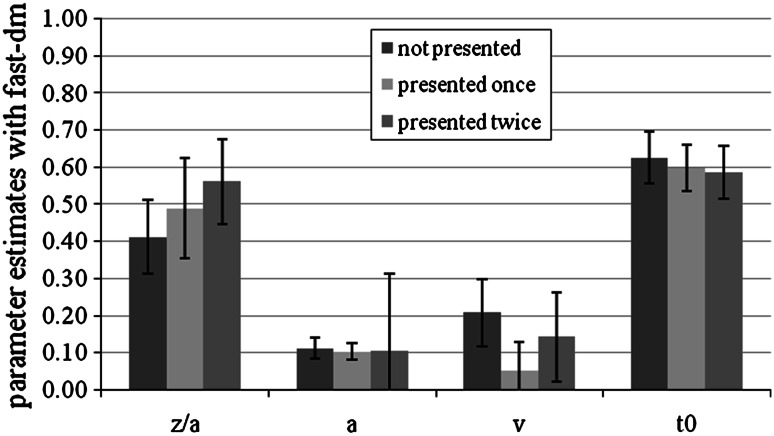
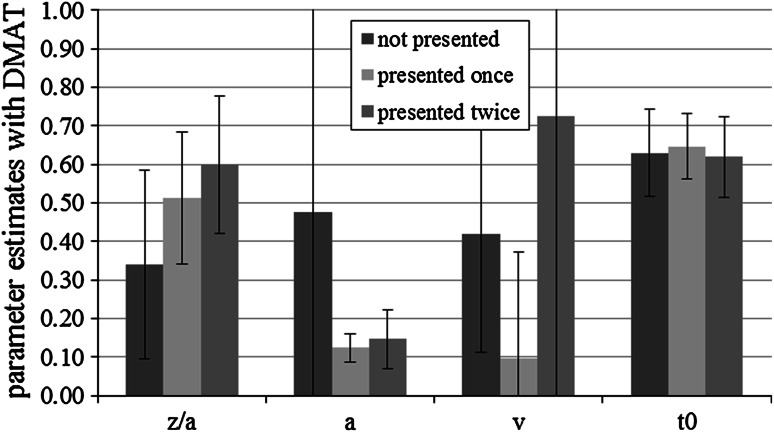
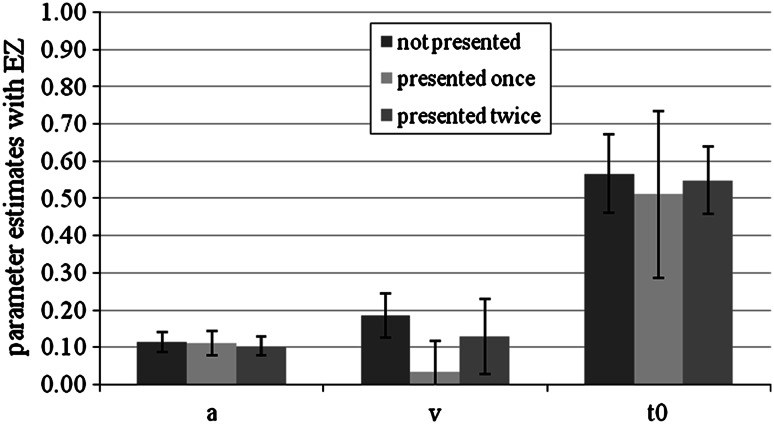
The diffusion model introduced by Ratcliff (Psychol Rev 85:59-108, 1978) has been applied to many binary decision tasks including recognition memory. It describes dynamic evidence accumulation unfolding over time and models choice accuracy as well as response-time distributions. Various parameters describe aspects of decision quality and response bias. In three recognition-memory experiments, the validity of the model was tested experimentally and analyzed with three different programs: fast-dm, EZ, and DMAT. Each of three central model parameters was targeted via specific experimental manipulations. All manipulations affected mainly the corresponding parameters, thus supporting the convergent validity of the measures. There were, however, smaller effects on other parameters, showing some limitations in discriminant validity.


Figures

Fig. 1
Fig. 1
Schematic illustration of the diffusion model. The process starts at the starting point z and accumulates information over time until one of two thresholds is reached. The speed of information accumulation is indicated by the drift rate v. Due to random influences the process is not linear, but fluctuates between the thresholds. The upper threshold a is associated with the old response, the lower threshold 0 is associated with the new response. As soon as a threshold is reached the corresponding response is initiated. Adapted from “An illustration of the random walk and diffusion process, together with relatedness distributions that drive the diffusion process” by Ratcliff (1978), A theory of memory retrieval. Psychological Review, 85, p. 64, and “Schematic illustration of the diffusion model” by Voss et al. (2004), Interpreting the parameters of the diffusion model: an empirical validation. Memory & Cognition, 32, p. 1207
Fig. 2
Fig. 2
Mean fast-dm parameter estimates for new-bias and old-bias conditions in Experiment 1. Bars represent standard deviation. We show the absolute values of the drift rates. z/a represents the bias parameter, a the threshold parameter, v old the drift rate for old items, v new the drift rate for new items, and t 0 the response-time constant
Fig. 3
Fig. 3
Mean DMAT parameter estimates for new-bias and old-bias conditions in Experiment 1. Bars represent standard deviation. We show the absolute values of the drift rates. z/a represents the bias parameter, a the threshold parameter, v old the drift rate for old items, v new the drift rate for new items, and t 0 the response-time constant
Fig. 4
Fig. 4
Mean fast-dm parameter estimates for speed and accuracy conditions in Experiment 2. Bars represent standard deviation. We show the absolute values of the drift rates. z/a represents the bias parameter, a the threshold parameter, v old the drift rate for old items, v new the drift rate for new items, and t 0 the response-time constant
Fig. 5
Fig. 5
Mean DMAT parameter estimates for speed and accuracy conditions in Experiment 2. Bars represent standard deviation. We show the absolute values of the drift rates. z/a represents the bias parameter, a the threshold parameter, v old the drift rate for old items, v new the drift rate for new items, and t 0 the response-time constant
Fig. 6
Fig. 6
Mean EZ parameter estimates for speed and accuracy conditions in Experiment 2. Bars represent standard deviation. a represents the threshold parameter, v the drift rate for correct answers, and t 0 the response-time constant
Fig. 7
Fig. 7
Mean fast-dm parameter estimates for not presented items, items presented once and items presented twice conditions in Experiment 3. Bars represent standard deviation. We show the absolute values of the drift rates. z/a represents the bias parameter, a the threshold parameter, v the drift rate, and t 0 the response-time constant
Fig. 8
Fig. 8
Mean DMAT parameter estimates for not presented items, items presented once and items presented twice conditions in Experiment 3. Bars represent standard deviation. We show the absolute values of the drift rates. z/a represents the bias parameter, a the threshold parameter, v the drift rate, and t 0 the response-time constant
Fig. 9
Fig. 9
Mean EZ parameter estimates for not presented items, items presented once and items presented twice conditions in Experiment 3. Bars represent standard deviation. We show the absolute values of the drift rates. a represents the threshold parameter, v the drift rate, and t 0 the response-time constant

References

    1. Boywitt CD, Rummel J. A diffusion model analysis of task interference effects in prospective memory. Memory & Cognition. 2012;40:70–82. doi: 10.3758/s13421-011-0128-6. - DOI - PubMed
    1. Bröder A, Schütz J. Recognition ROCs are curvilinear—or are they? On premature arguments against the two-high-threshold model of recognition. Journal of Experimental Psychology. Learning, Memory, and Cognition. 2009;35:587–606. doi: 10.1037/a0015279. - DOI - PubMed
    1. Cohen J. Statistical power analysis for the behavioral sciences. Hillsdale: Erlbaum; 1988.
    1. Criss AH. Differentiation and response bias in episodic memory: evidence from reaction time distributions. Journal of Experimental Psychology. Learning, Memory, and Cognition. 2010;36:484–499. doi: 10.1037/a0018435. - DOI - PubMed
    1. Cronbach LJ, Meehl PE. Construct validity in psychological tests. Psychological Bulletin. 1955;52:281–302. doi: 10.1037/h0040957. - DOI - PubMed

LinkOut - more resources