. 2014 Dec;13(12):2805-16.
doi: 10.1158/1535-7163.MCT-13-1091. Epub 2014 Oct 3.

Inhibition of monocarboxylate transporter-1 (MCT1) by AZD3965 enhances radiosensitivity by reducing lactate transport

Affiliations

Inhibition of monocarboxylate transporter-1 (MCT1) by AZD3965 enhances radiosensitivity by reducing lactate transport

Becky M Bola et al. Mol Cancer Ther. 2014 Dec.

Abstract

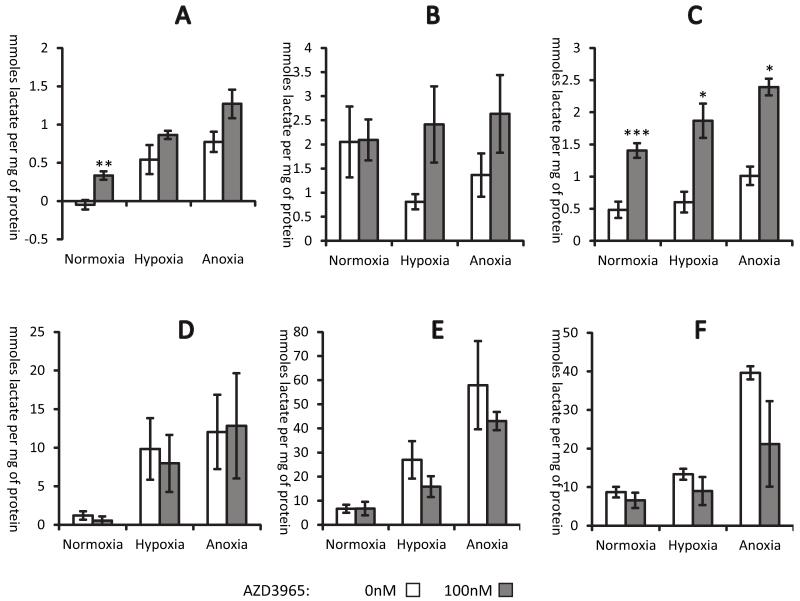
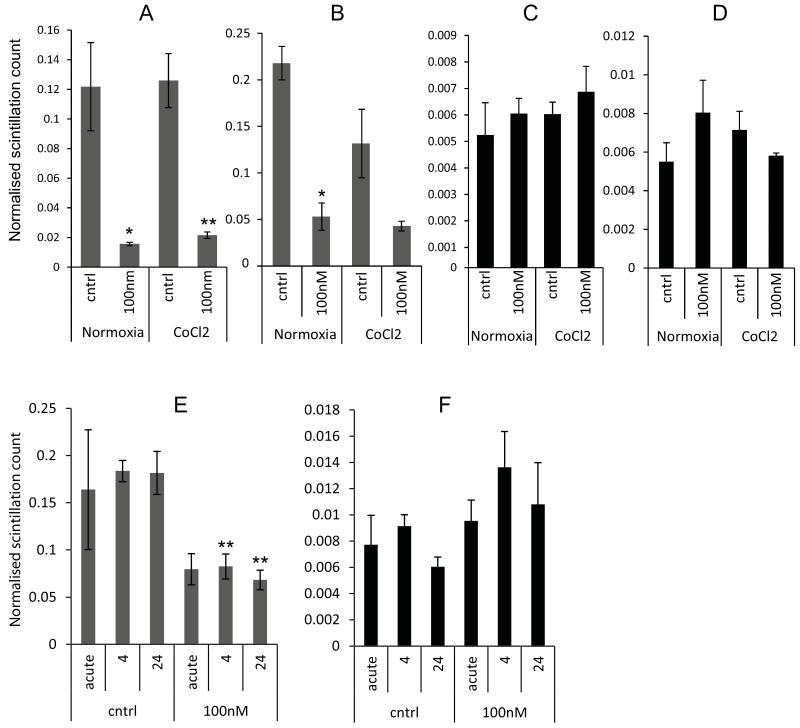
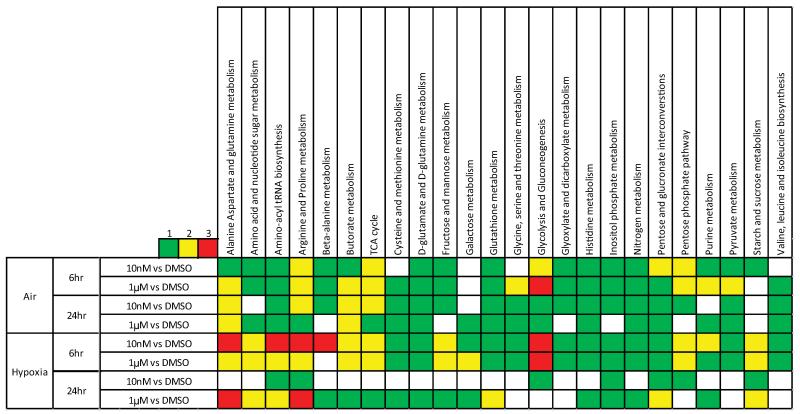
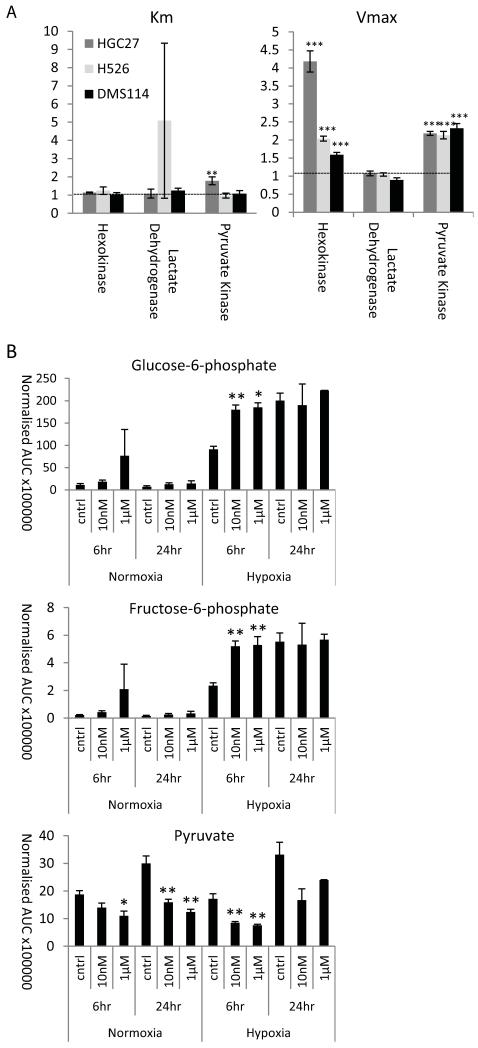
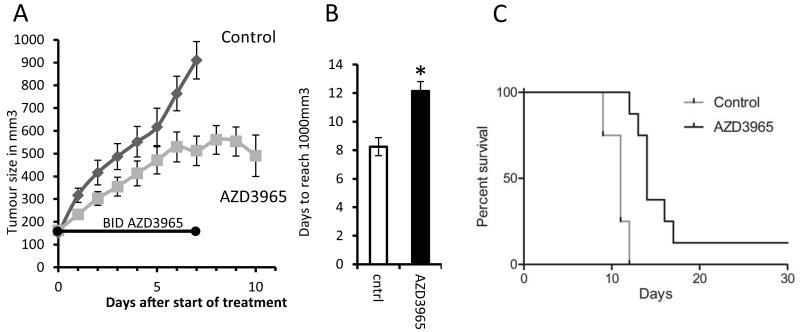
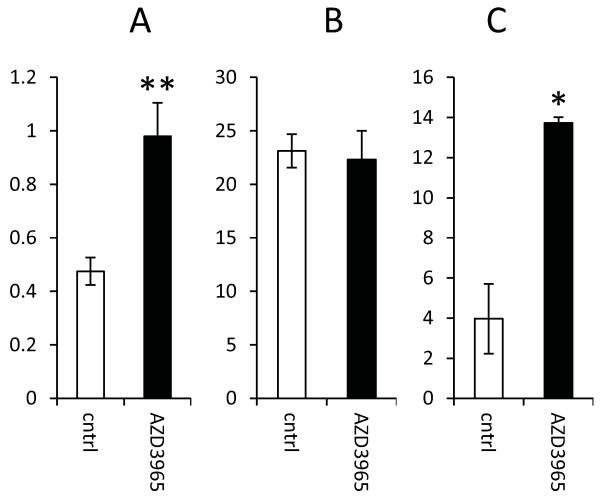
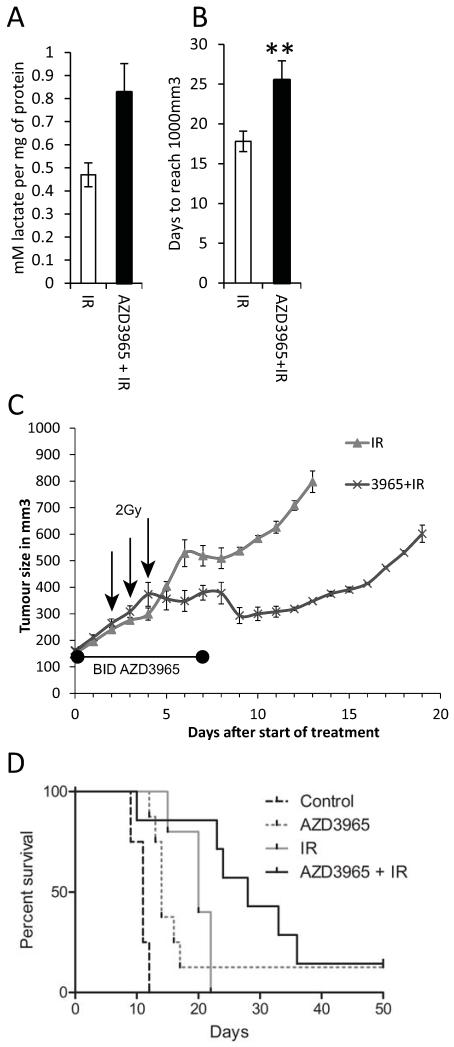
Inhibition of the monocarboxylate transporter MCT1 by AZD3965 results in an increase in glycolysis in human tumor cell lines and xenografts. This is indicated by changes in the levels of specific glycolytic metabolites and in changes in glycolytic enzyme kinetics. These drug-induced metabolic changes translate into an inhibition of tumor growth in vivo. Thus, we combined AZD3965 with fractionated radiation to treat small cell lung cancer (SCLC) xenografts and showed that the combination provided a significantly greater therapeutic effect than the use of either modality alone. These results strongly support the notion of combining MCT1 inhibition with radiotherapy in the treatment of SCLC and other solid tumors.


Figures

Figure 1
Figure 1. AZD3965 increases intracellular lactate whilst decreasing the amount of extracellular lactate
Cells were treated with 100nM AZD3965 in normoxia, hypoxia or anoxia for 24hrs prior to determining lactate concentrations. Intracellular lactate A), B) and C); extracellular lactate D), E) and F). H526 cells, A) and D); HGC27 cells, B) and E); DMS114 cells, C) and F). Significantly different; drug treated versus controls; *, **, ***, P<0.05, P<0.01, P<0.001 respectively. Mean and SEMs are derived from 3 independent experiments.
Figure 2
Figure 2. AZD3965 significantly reduces lactate uptake
The uptake of lactate (A and B) and glucose (C and D) was measured 24 hours after exposure to AZD3965 in the presence or absence of Cobalt Chloride. A and C DMS114 cells and B and D HGC27 cells. Panels E) and F) show time course assays, where AZD3965 was applied for the number of hours indicated; “acute” dosing is when drug was administered concomitant with radiolabelled metabolite. E) lactate, F) glucose. Significantly different; drug treated versus controls; *, **, P<0.05 and P<0.01, respectively. Mean and SEMs derived from 3 independent experiments.
Figure 3
Figure 3. The effect of inhibiting lactate transport on metabolism
The heat map represents the extent of change in a pathway when the two conditions indicated in the right hand column are compared. The colours indicate the number of the metabolites in that pathway that show a significant change in concentration. No weighting is given to the extent or the direction of the change in the levels of individual metabolites.
Figure 4
Figure 4. Inhibiting lactate transport increases glycolytic rate
A) Glycolytic flux analysis was used to compare the activity of three key glycolytic enzymes. Km and Vmax were calculated and are expressed as a ratio of the control cells to the cells treated for 24hr with 100nM AZD3965; the horizontal line indicates a value indicative of no change as a result of treatment with AZD3965. B) The concentrations of the individual metabolites measured in the glycolytic pathway (values represent area under curve (AUC) normalised to median AUC). Mean and SEMs derived from 3 independent experiments. Significantly different; drug treated versus controls; *, **, ***, P<0.05, P<0.01 and P<0.001 respectively.
Figure 5
Figure 5. AZD3965 slows H526 xenograft growth in vivo
A) In vivo growth curves showing tumour volume (mean and SEM) in mm3 post start of treatment; the growth curve finishes when the first tumour in each group reaches 1000mm3. The control group contained 5 mice the AZD3965 group contained 11 mice three of which were sacrificed for histology at the end of drug treatment (day 7). B) Days (±SEM) taken to reach 1000mm3 for each treatment group (significantly different; *, P = 0.004). In the AZD3965 group one mouse was cured and observed for a further 100 days after the tumour ceased to be visible and no tumour returned. This reduction in tumour size resulted in the apparent dip at the end of the AZD3965 growth curve and is why the Kaplan-Meier plot (C) does not reach zero for the AZD3965 group.
Figure 6
Figure 6. Effect of AZD3965 on lactate concentration, blood vessel density and MCT4 expression in H526 xenografts
A) Lactate concentration expressed as mM lactate per mg of protein; B) mean number of blood vessels per image of the tumour as visualised using the endothelial cell marker, CD31; C) proportion of tumour stained for MCT4. Significantly different; drug treated versus controls; *, **, P<0.05 and P<0.01 respectively.
Figure 7
Figure 7. Combining AZD3965 with radiation to treat H526 xenografts
A) Tumour lactate concentration at the end of drug treatment (P = 0.14); B) Days taken to reach 1000mm3, (mean and SEM, cured tumour not included), significantly different; drug plus radiation versus radiation alone; **, P = 0.02. The radiation only group contained 8 mice 3 of which were sacrificed at the end of the treatment period (7 days) for histology, the radiation plus AZD3965 group contained 10 mice 3 of which were sacrificed at the end of drug treatment for histology. C) In vivo growth curves showing tumour volume in mm3 (mean and SEM), the growth curve finishes when the first tumour reaches 1000mm3. The 2 Gy fractions of radiation were delivered midway between the two doses of AZD3965 on the days indicated with an arrow. In the AZD3965 + radiation group, one mouse was cured and observed for a further 100 days after the tumour ceased to be visible and no tumour returned. This is why the Kaplan-Meier plot (D) does not reach zero for the AZD3965 group; the dotted lines are taken from figure 5, with both experiments being carried out at the same time.

Similar articles

Cited by

References

    1. Gray LH, Conger AD, Ebert M, Hornsey S, Scott OCA. The concentration of oxygen dissolved in tissues at the time of irradiation as a factor in radiotherapy. Br J Radiol. 1953;26(312):638–48. - PubMed
    1. Karar J, Maity A. Modulating the tumor microenvironment to increase radiation responsiveness. Cancer Biol Ther. 2009;8(21):1994–2001. - PMC - PubMed
    1. Koch CJ, Kruuv J, Frey HE. Variation in radiation response of mammalian cells as a function of oxygen tension. Radiat Res. 1973;53(1):33–42. - PubMed
    1. Yasuda H. Solid tumor physiology and hypoxia-induced chemo/radio-resistance: novel strategy for cancer therapy: nitric oxide donor as a therapeutic enhancer. Nitric Oxide. 2008;19(2):205–16. - PubMed
    1. Pavlides S, Whitaker-Menezes D, Castello-Cros R, Flomenberg N, Witkiewicz AK, Frank PG, et al. The reverse Warburg effect: aerobic glycolysis in cancer associated fibroblasts and the tumor stroma. Cell Cycle. 2009;8(23):3984–4001. - PubMed

Publication types

MeSH terms

LinkOut - more resources